Substack Library
GlossarySizing Your Bets
May 30, 2025THIS IS NOT INVESTMENT ADVICE. INVESTING IS RISKY AND OFTEN PAINFUL. DO YOUR OWN RESEARCH.
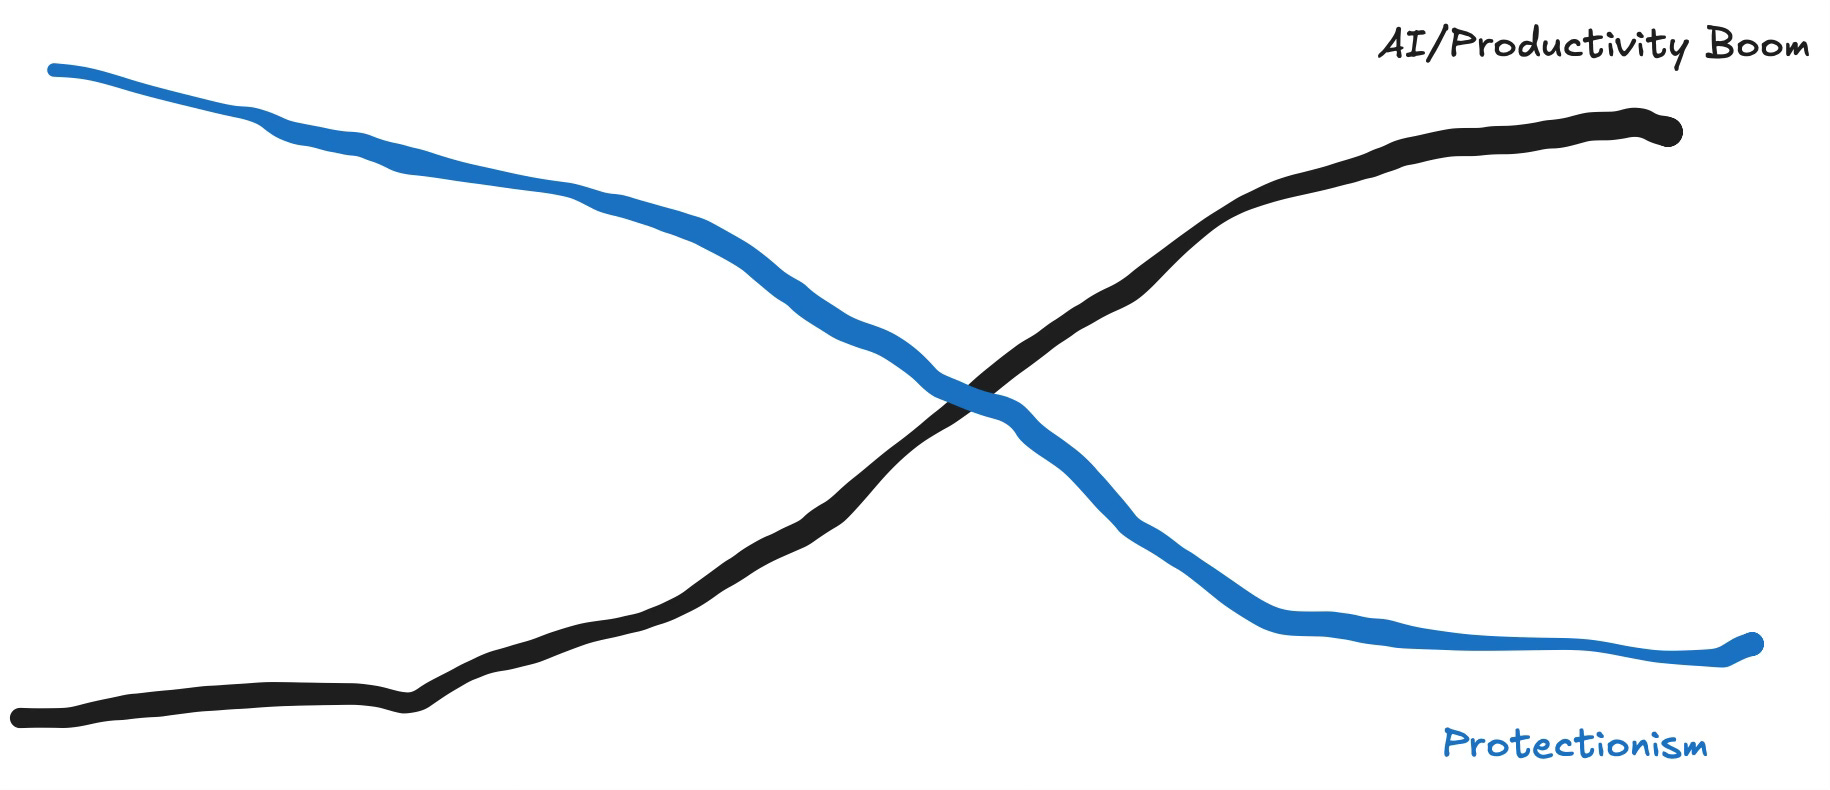
Regular readers know I believe that to manage this unusual environment, a portfolio (your savings) must properly balance two offsetting pressures—AI and Trump. Both are massive forces, often putting opposite pressure on a (market) asset. For instance, White House (WH) policy is bearish for longer-term bonds (bond supply goes up and inflation goes up), while AI is bullish (because the cost of labor falls, so inflation falls). Similarly, WH policy is bearish for the dollar, while AI is bullish (because foreigners want to own U.S. AI stocks).
To date, the balance of these forces in the U.S. has been… zero. The return on U.S. bonds and stocks is modestly negative. That’s unusual. At this point in the year, a typical mix of 50% stocks and 50% bonds is up about 4%.
President Trump has a vision. You may like or dislike that vision, but he clearly has one, and we should by now know not to underestimate him. He campaigned and is now putting into place his plan to ensure working-class towns are free of fentanyl and illegal immigrants, flush with tax cuts, and, down the line, a shiny new factory with high-paying jobs. The vision is familiar to us and, at its core, negative for asset prices—thus the Main Street versus Wall Street refrain from WH officials.
The President moved fast and aggressively and is now tied up in court, creating uncertainty that will stretch out over months. If we knew 100% that Trump would achieve his vision, the perfect portfolio given current valuations would be short U.S. stocks, short long-duration bonds, and short the dollar. We don’t know for certain he will achieve his goals, but he probably will—so these positions deserve some weight in a portfolio.
AI is a different vector. We have now come through the earnings of all the big tech companies, and they were generally fantastic. AI is excellent for corporate profits because it allows companies to do the same thing they were doing—providing services—for less money, as a lot of technology functions can be replaced with AI, as well as many other white-collar jobs. We may see this in the employment statistics soon. This technology is bullish for stocks (better margins), bullish for bonds (lower inflation due to lower labor costs), and bullish for the dollar because the epicenter of the non-China AI story is in the U.S., and excitement about this draws in foreign money.
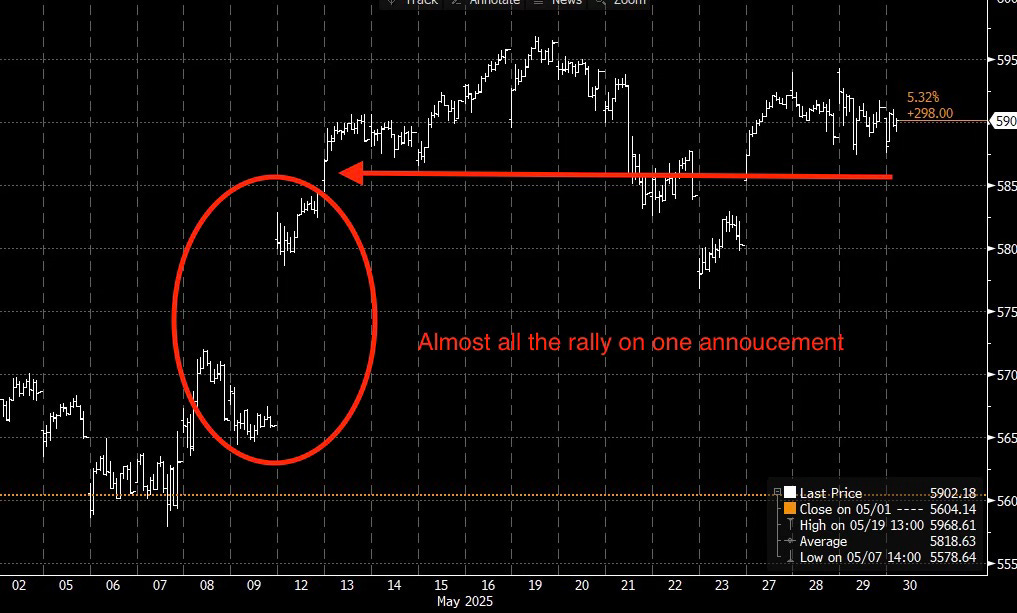
Both these forces contend on any given week or day. AI days are bullish for assets, as are days of tariff delays. Trump days are bearish. AI is more like a slow, powerful force, while the Trump days are sporadic and unpredictable. For instance, this month U.S. stocks are up, but almost the entire move came in a single day when the U.S. and China rolled back tariffs. That’s the gap in the chart below.
We know a tariff counter-attack is coming, whereby the White House will re-institute tariffs using a different legal cover, which will almost certainly create a down move in the stock market and then protracted uncertainty. We also know we are likely to see continued breakthroughs in AI that lead to excitement. We just don’t know when any of this is going to happen.
There are different ways of solving this riddle. One approach is to assume AI wins out in the end—put your money in tech stocks and ride out the volatility. April had a 20% loss. Another equally large—or larger—loss could transpire. My own approach is to build a portfolio that weighs the odds of each force and scores assets accordingly. How much of each bet to hold? That’s both art and science, like any investment process.
My most recent book:
The Uncomfortable Truth About Money