Substack Library
GlossarySlowing Rates of Change
December 5, 2025THIS IS NOT INVESTMENT ADVICE.
It was not easy or snug this world she had known for close on seventy years. Bowed down she was with weariness.
To the Lighthouse, Virginia Woolf, 1923
The consensus is the US economy is fine, the easing cycle largely coming to an end and the AI capex spend will boost growth next year, particularly in power. The reality seems to be that the rate of change is slowing on hiring and AI and the build out in power is incremental. The risk to the narrative is a more rapid weakening of US employment relative to expectations; a fear of rising prices may give way to a fear about the labor market.
In more detail.
-
Economic growth is a measure of the rate of change of what is consumed. This means that if you bought $1 of bread in 2024 and $3 of bread in 2025 and then buy $4 of bread in 2026, the rate of economic growth slowed even if you still bought bread. To figure out what happens next you must always be anchored to rate of change.
-
The rate of change for households is negative. Wages are growing…but less fast than they were. Borrowing is positive, but less positive than it was. The equity market (important for upper income spending) is rising, less fast than it was. Together, these probably spell weaker household spending. What about the tax cuts next year? It depends on how much of these are saved (like no taxes on tips) versus spent. If health care premiums shoot higher, as they will January 1, does spending accelerate? Maybe not.
-
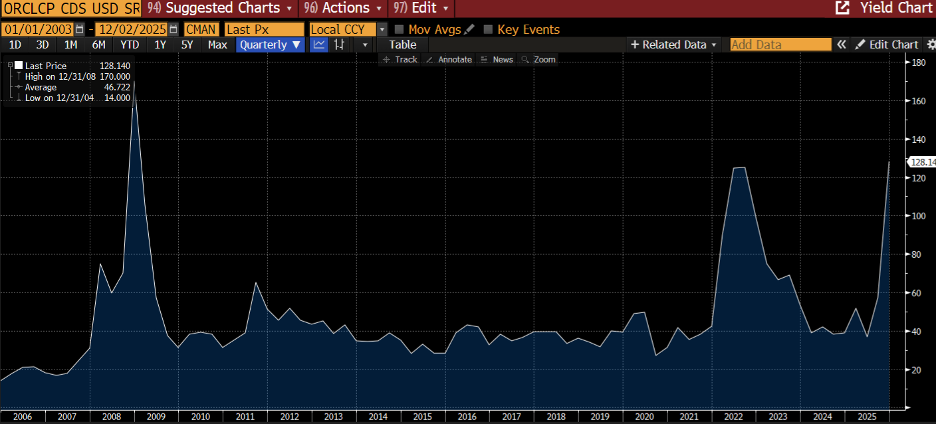
The corporate sector is earning plenty of money. The question is if the rate of change on their new spending will go up next year. The answer is…it depends how you measure it. If you look at the Mag7, the answer is “it will slow.” Meta announced Thursday they are slashing spending in the “Metaverse,” an indication the strain of funding AI capex is impacting even the strongest balance sheets. There are anywhere between 500 and 1500 data centers getting built (depending on how you measure) so measuring the aggregate rate of spend is involved. We know the cost of capital for this spending is increasing. The risk of default on one of the key nodes in this universe, Oracle (shown below), is at its highest level since 2008. In other words, the market does not think their spending will work and/or this has become a proxy to short the private company OpenAI.
AI is both incredible and, so far, banal. It is a “smart student” not a creative thinker. The bet is that AI will soon become a creative thinker. But for markets, the difference between that day being three years away or 10 is material. It’s possible that we are on the cusp of a shift in perception—AI was supposed to bring me a free robot to eliminate mundane work but instead all it did was produce job insecurity and a higher electricity bill. We need constant whiz bang to sustain the narrative.
-
Voters globally are looking for a magic solution to a knotty problem—how to grow the pie. As the years have worn on, they’ve tended to endorse ever more far-fetched ideas, evident in the US, New York City, London and, while not really an endorsement, Beijing and Moscow. Tariffs don’t make sense. In practice they’ve been difficult to implement and are probably illegal. Similarly, trying to protect social benefits and narrow the budget deficit (UK) is about as easy as opening a government-controlled grocery store when your subway needs TLC (New York). Lingering, unresolved, are the large fiscal deficits, deficits that get much worse if growth slows.
-
The actual labor market data in the US is concerning if contradictory. The Fed surveyed their districts and got back this: “employment declined slightly over the current period with around half of Districts noting weaker labor demand. Despite an uptick in layoff announcements, more Districts reported contacts limiting head counts using hiring freezes, replacement-only hiring, and attrition than through layoffs.” Yes, not all data agrees. It never does. But the rate of change here too seems negative.
-
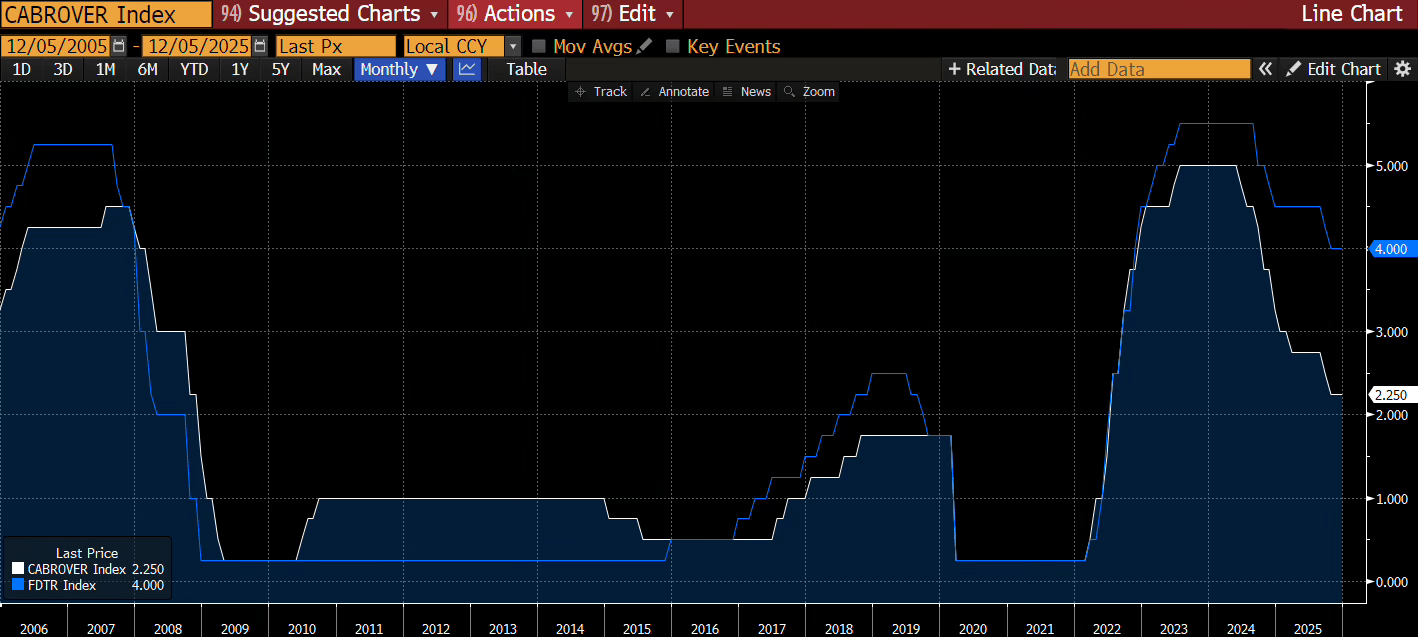
The market believes we will get a “hawkish” cut next week. Literally every bank report I’ve read says this. It is an “insurance cut,” they assert. When we got such pivots from the Bank of Canada and the European Central Bank, bonds promptly sold off and that is what many are thinking is about to happen in the US. Maybe. If I were on the Fed, I’d be more concerned about a faster slowing, declining employment. If the labor market does begin to wobble more, it would certainly not be, in retrospect, a surprise. We’ve had erratic government policy all year, policy that is so erratic the Fed has not been able to properly calibrate, first due to tariffs then due to the shutdown and lack of data. As a result, the Fed has gone slow while other central banks have moved faster, leading to a gradual erosion of economic activity. For instance, US policy rates are 4%, while they are 2.25% in Canada and 2% in Europe. Both the US and Canada jacked rates up to deal with Covid inflation, but in Canada they brought them back down while in the US they have not. Now there are signs of a rebound in Canadian hiring, which is how it is supposed to work.

Meanwhile, US companies, uncertain of what environment they are facing have turned to their favorite thing to do—slash costs, leading first to a “no-hire” dynamic, and now, a “fire” dynamic. As the Fed said: “Meanwhile, AI is reportedly reducing the demand for workers in certain roles, such as customer service, especially at larger companies.” The big shock would be a dovish cut.