Substack Library
GlossaryInflation
April 23, 2026Not investment advice.
Last week, for a moment, it appeared the Strait was open.
“In line with the ceasefire in Lebanon, the passage for all commercial vessels through the Strait of Hormuz is declared completely open…,” Foreign Minister Abbas Araghchi said on Friday, April 17, on X.
It turns out there are two Iranian foreign ministers, and the second one—the IRGC—sees it in their interest to keep the Strait closed.
This fact brings us back to counting the oil flow, product deficit and the level of demand destruction, all of which are large. Each day the oil doesn’t flow, the pressure on prices grows. For instance, chemical products that most of us don’t pay any attention to, like ethylene—22% of which goes through the Strait—are in short supply, particularly in Asia. Higher ethylene prices mean higher prices for all sorts of goods, like yogurt or toothpaste containers.
Trading the “will it open, will it not open” is a mug’s game. If the Iranian Foreign Minister doesn’t speak for the government, who does? The odds are higher for an opening because doing so is one of the few issues both China and the US agree upon. But the closing to date has put into motion enough disruption that we may be on the verge of Covid-style price disruptions. Note that the Covid pandemic was declared in March 2020 and prices did not start rising until around six months later. Now, six years later, prices were finally supposed to return to a low level after being temporarily boosted last year by tariffs.
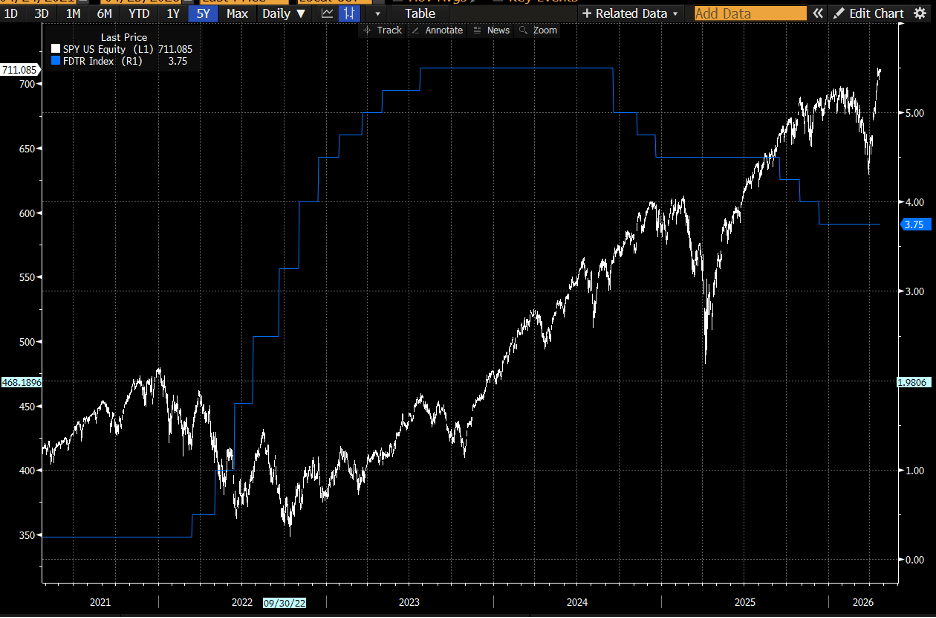
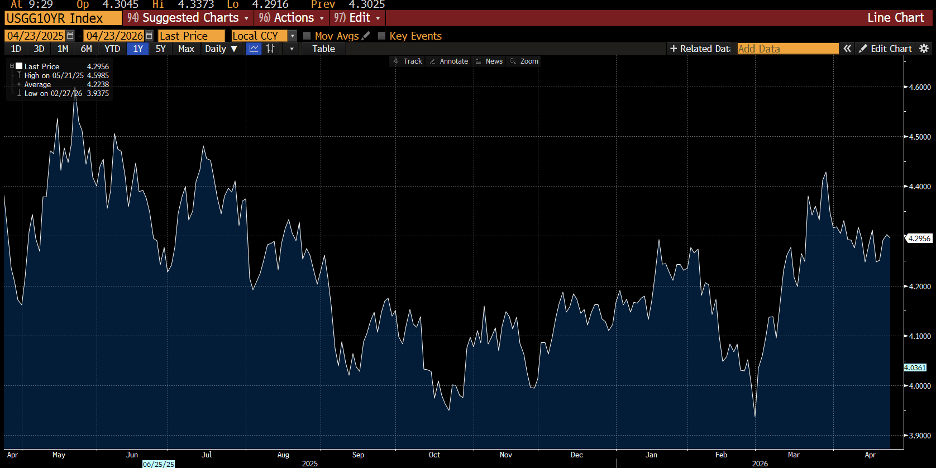
Most of the return on assets comes when central banks are easing. These price disruptions might mean we are on the cusp of tightening. The only meaningful bear market in the last 15 years occurred the last time such a tightening happened, in 2022. Once the market smelled the coming withdrawal of liquidity in early 2022, stocks stopped going up. The actual tightening didn’t come until three months later, as you can see below.
Since 2024, the path has been easing, reversing the tightening related to Covid-era disruptions. That easing, as well as the AI boom, has been bullish for assets. Below I show the current policy rates from the Fed, ECB, and RBA and others.
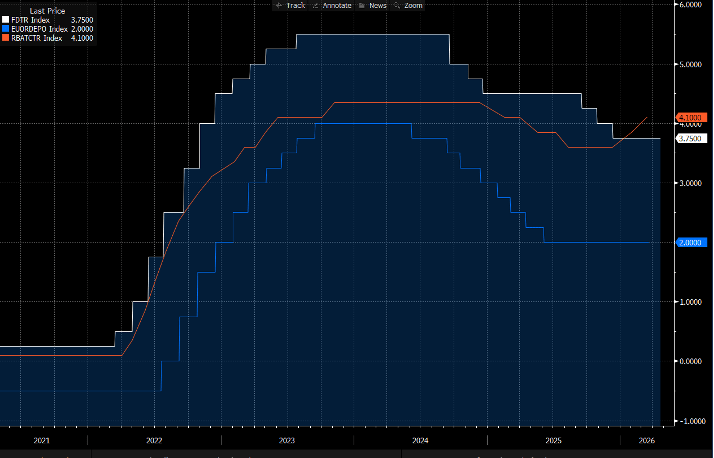
The RBA diverged from this path once price pressures emerged. Particularly given the resilience of stock markets, an easing this year now seems implausible. The US, UK, and Europe are well above target, as I show below. Only Canada and Switzerland are in range.
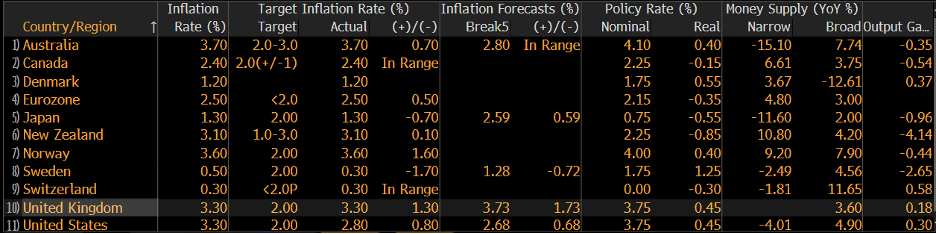
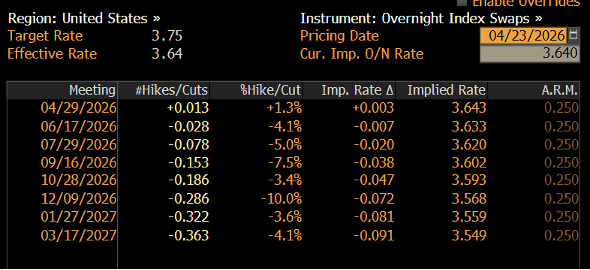
Of them all, US pricing is the most extreme—the Fed is discounted to ease modestly, even though inflation is now likely to be close to 4% this summer.
In the short term, the energy shock outweighs the deflationary AI shock. If central banks are slow to boost the policy rate, the long end will sell off. What would you do if you were the central bank? At this point, probably nothing. But if inflation starts to print at 3% in Europe and 4% in the US, will they do nothing? At two months, maybe you begin to do something. At three months, for sure, you do.
The inflation shock is due to bad luck and erratic policy—first Covid (bad luck), then, years later, tariffs, now a war with a less and less obvious exit ramp. A template for policy blunder is Brexit. Post-Brexit, UK growth, employment, and productivity are all lower. As a result, the UK is having a tough time attracting financing because their income is weak, which then creates a self-reinforcing negative loop. Unemployment is almost 5% in the UK, but inflation is high, in part because productivity is too low to get interest rates lower. Yes, the AI boom in the US offsets some of this, but each day oil prices remain elevated, the inflation risk grows.