
Substack Library
GlossarySupply, Policy and Opportunity
July 25, 2026Not investment advice.
For the last few months, cash has outperformed due to simultaneous supply shocks to stocks, bonds and commodities. To be sure, supply isn’ t the only driver of markets but it is a significant one. This fall in the value of stocks and bonds and the increase in the price of energy boosts the odds of a policy response—both military and monetary—which in turn creates opportunities. Below in more detail.
Stocks
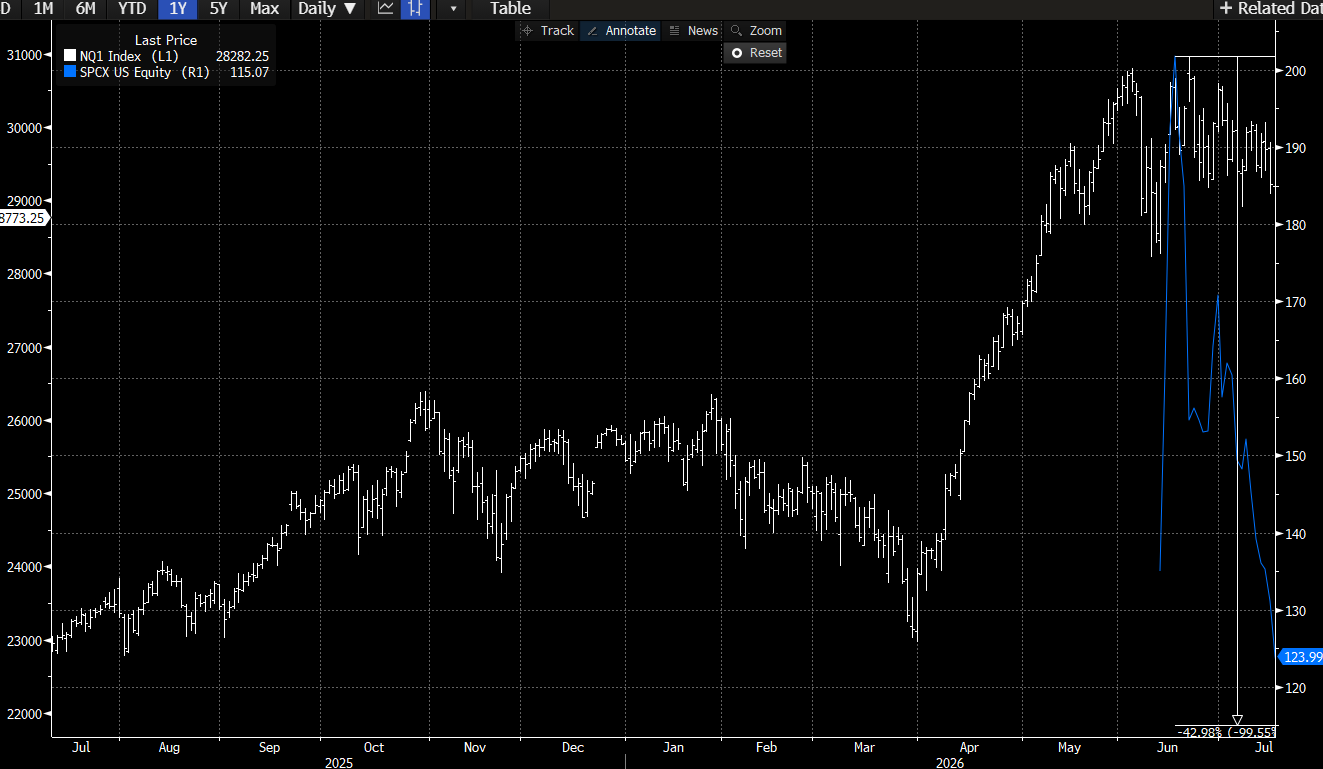
So far in this earnings season, technology earnings per share are up about 75% and the Nasdaq is down 9%. SpaceX IPO’d on June 12 and the Nasdaq hit its high on June 1. SpaceX entered the Nasdaq in July and has since traded down by 40%, as shown below, dragging the index lower. The only company that fell by more was Rocket Lab. Marvell, ARM and CoreWeave also fell sharply but by less than SpaceX. Moreover, in June and July, $96 billion of stock was issued by companies in the index. The market is struggling to absorb supply, despite the mostly solid earnings. Long Nasdaq = long SpaceX.
Bonds
Bonds too are down. US 10 year yields are up about 30 basis points in the last six weeks. Some of this can be explained by oil, as the chart below shows (the blue line is oil).
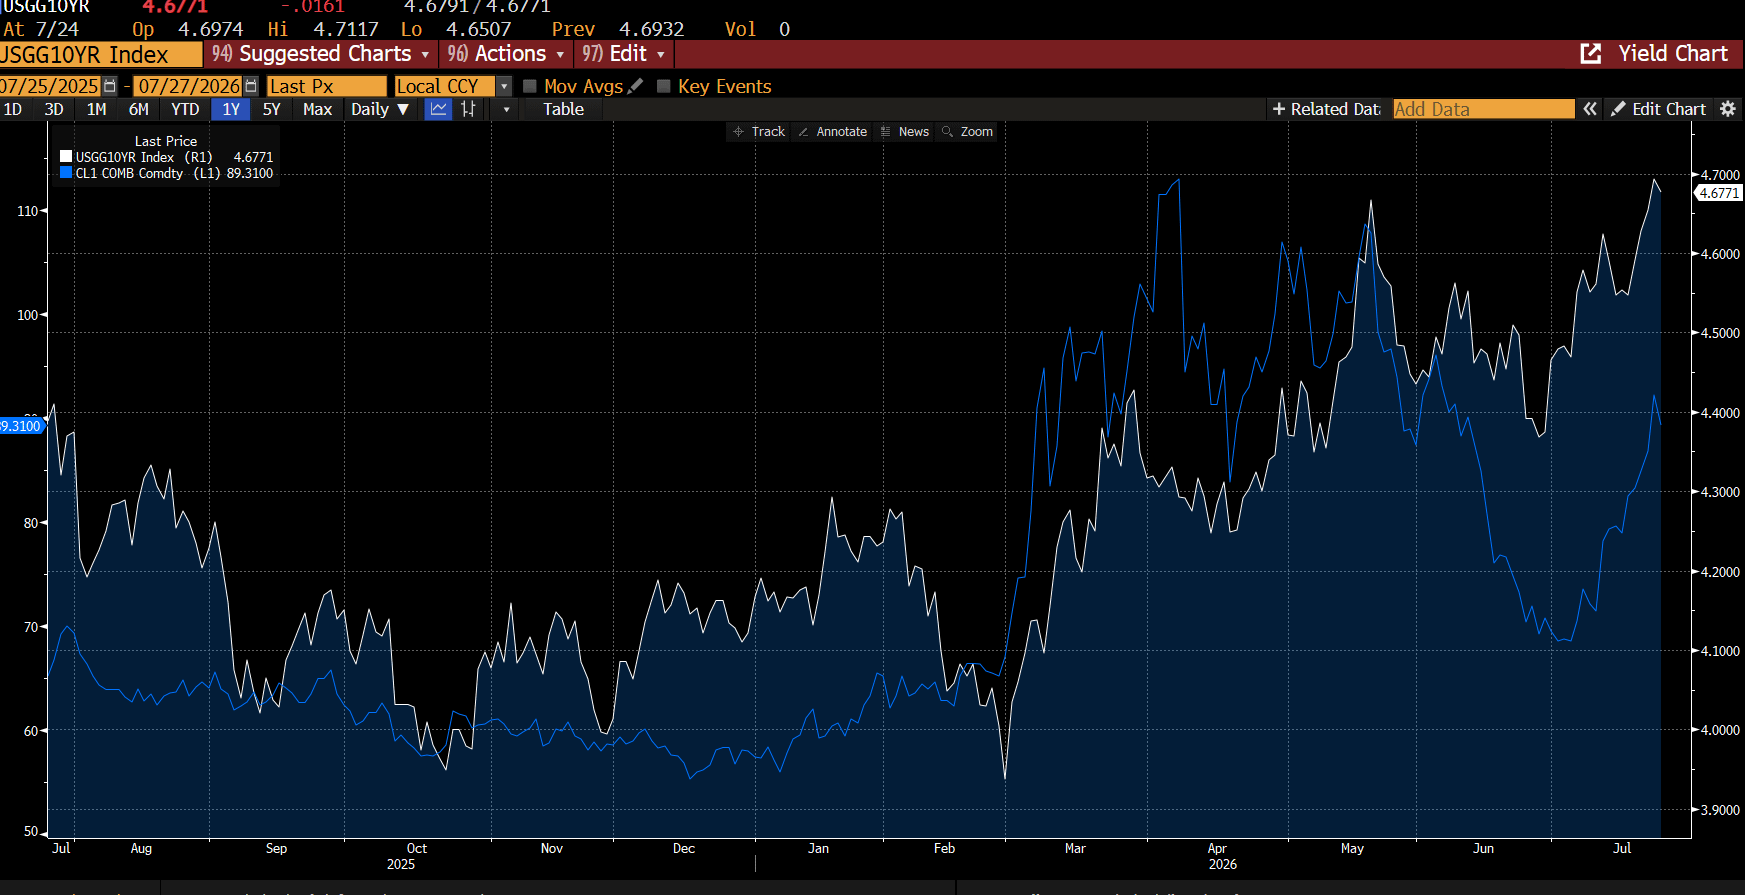
That’s only part of the story, however. Supply is too. Not only is the US running a 5.6% budget deficit, but Mag7 companies like Nvidia and Amazon have issued about $50 billion of bonds in the last six weeks.
Oil
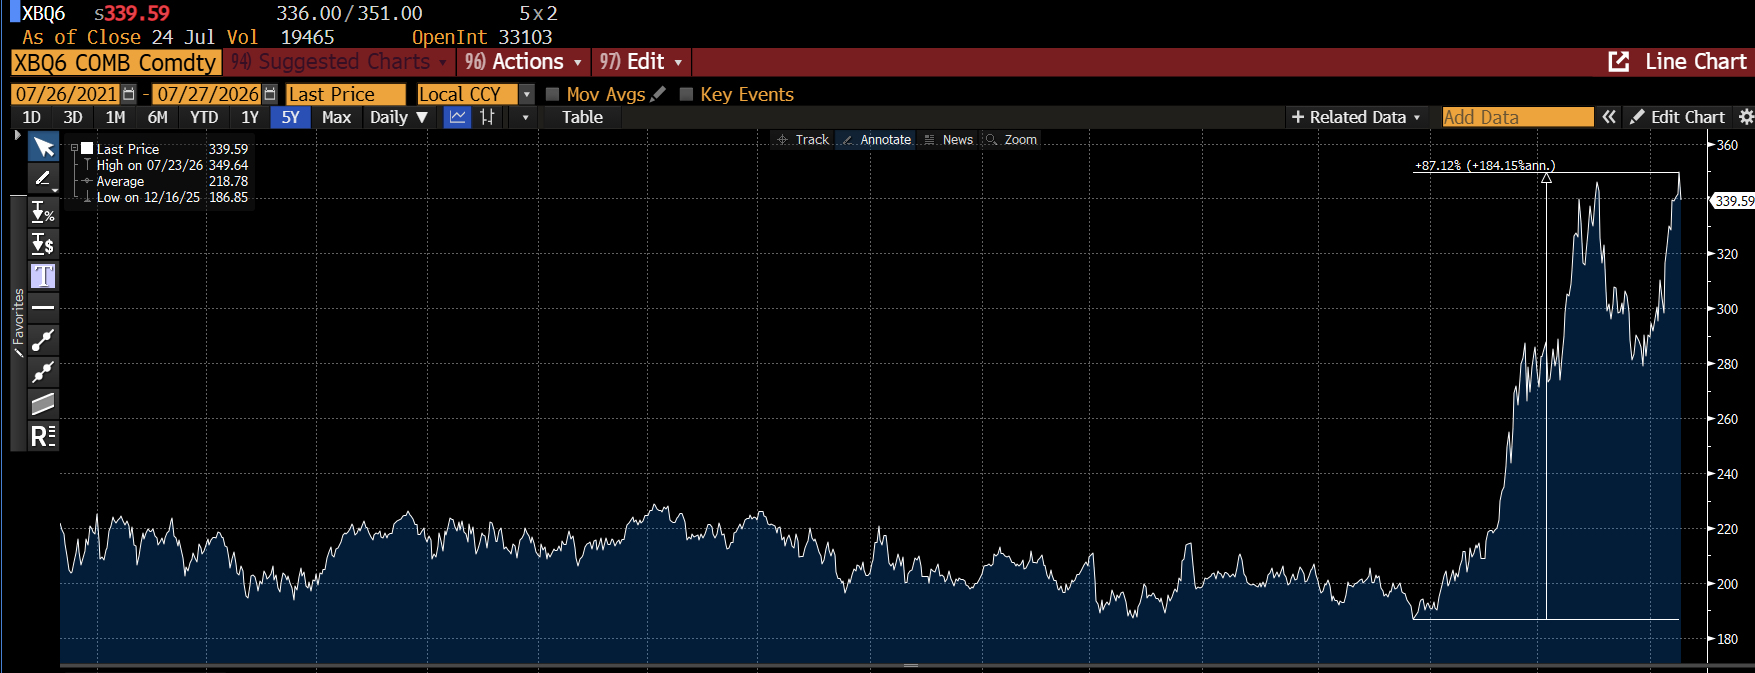
Oil, and particularly gasoline, is the last piece of this. Gasoline prices are up 87% due to a shortage of oil and refining capacity from both the Middle East and Russia.
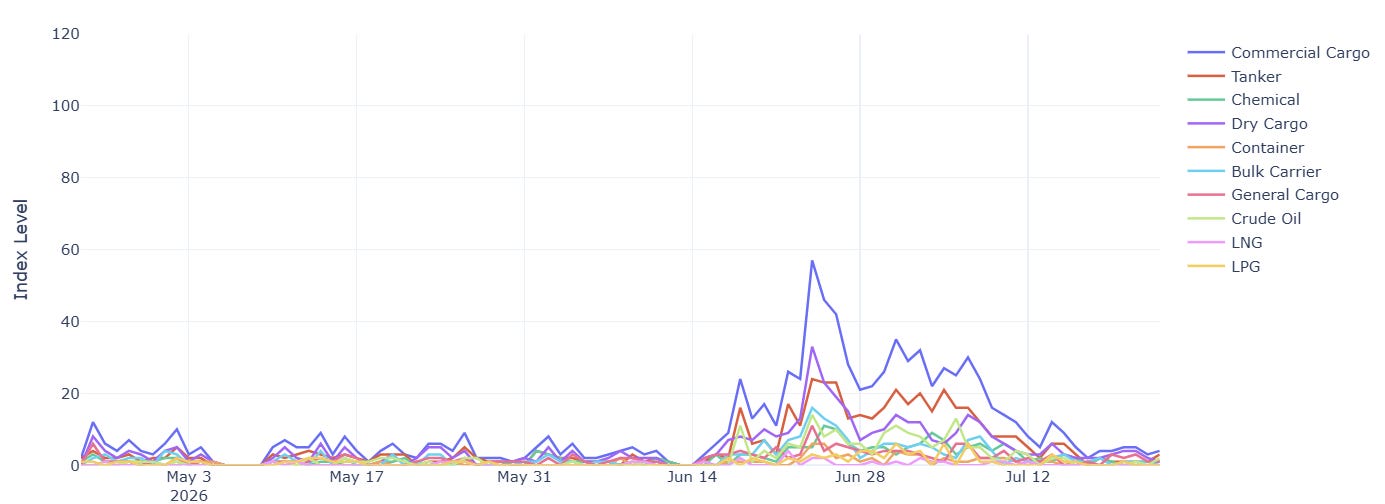
Oil simply isn’t flowing. Below is Kate’s tracker of ship traffic in the Strait of Hormuz. Back to almost zero. While it may be considered unpatriotic to say it, Trump, like Putin, is losing the war.
Policy Response and Opportunities
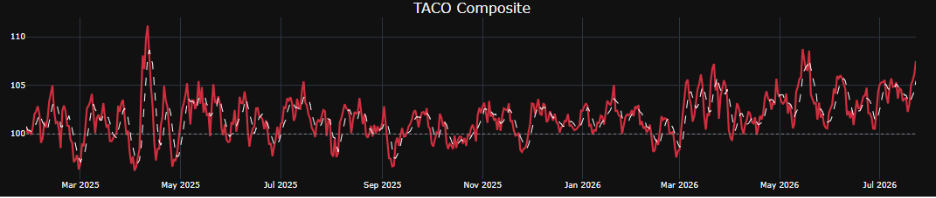
Based on past behavior, the odds of the White House retreating are high, as shown below. This is a gauge Kate built that measures both market conditions and political pressures. In the past (April last year and in May) Trump pivoted when market stress reached close to these levels.
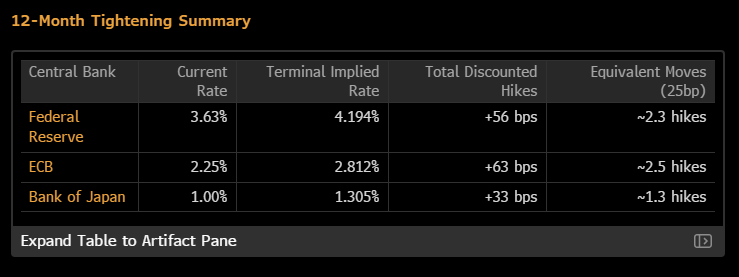
The market anticipates a monetary policy response as well. Below is the discounted tightening by central banks. Multiple hikes are expected even though in most countries core inflation is low and there is little sign that higher oil prices are hitting prices overall. The Fed meets Wednesday and their recent commentary has been decidedly hawkish.
Opportunities
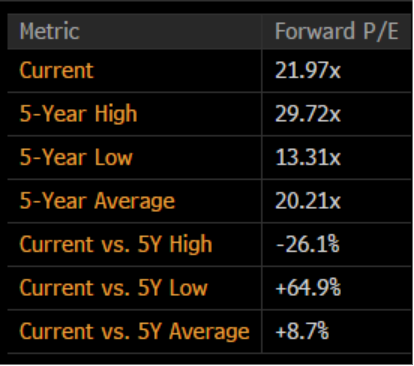
This week, X was on fire about the attractiveness of owning US bonds with 3% real yields. Those yields are indeed attractive. If, however, Trump breaks with past behavior and, despite the costs, attacks Iran, yields will rise yet further. Effectively, the risk of further escalation lowers the ratio (return divided by risk) of the bet. In the turmoil, the good is getting thrown out with the bad. For instance, Google shares are trading cheaper than they have been since the AI boom began, even though they seem to be a clear AI winner because they own the “full-stack”—application, cloud, model, chip, as well as other bells and whistles like YouTube and Waymo.
AI is a deflationary productivity shock and, as such, bullish for assets long term. But the tail risk of war, tightening and a supply shock makes navigation more complicated than it might appear at first glance. In the very short term, given the pricing, if Trump does back down, stocks and bonds will move sharply higher.