Substack Library
GlossaryFour Vectors & Discounting
June 19, 2025THIS IS NOT INVESTMENT ADVICE. INVESTING IS RISKY AND OFTEN PAINFUL. DO YOUR OWN RESEARCH.
There are four major vectors—growth, tech, tariffs, and war. These forces, applied to current market conditions, suggest the most likely path forward. In sum, being long assets (owning stocks and bonds) is unattractive, particularly with the rising risk of war. However, being outright short is also risky—what if war is averted? As a money manager, I adjust my bets as facts evolve. While I prefer directional bets, right now I’m focusing on relative value strategies.
Below are the vectors and the discounting.
The Vectors
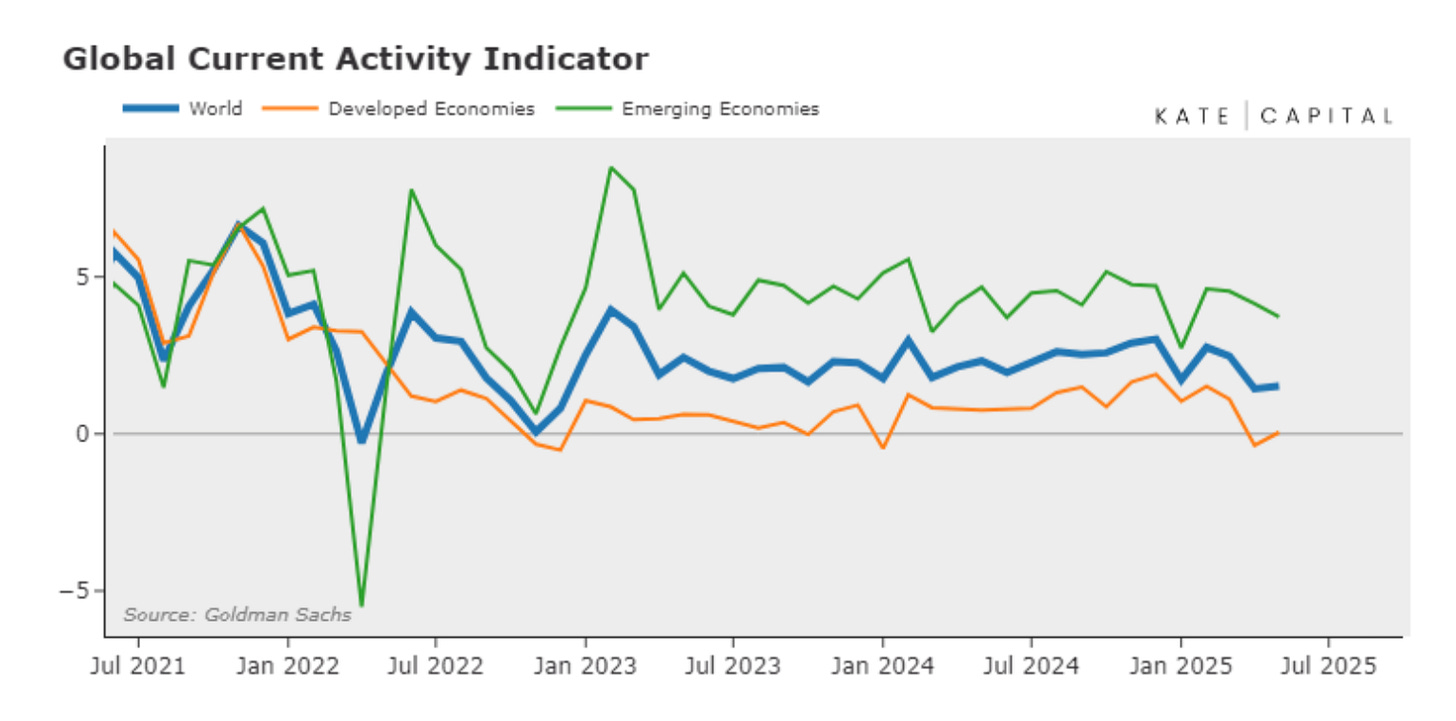
1. Slowing economic growth. After the government fiscal-fueled COVID boom, the global economy is ebbing. Spending is income and borrowing, and income is slowing because unemployment is gradually rising and private sector borrowing is weak due to high interest rates. Thus, slowing growth. Below is our measure of global growth. Note that developed world growth is around 0.
Source: Goldman Sachs
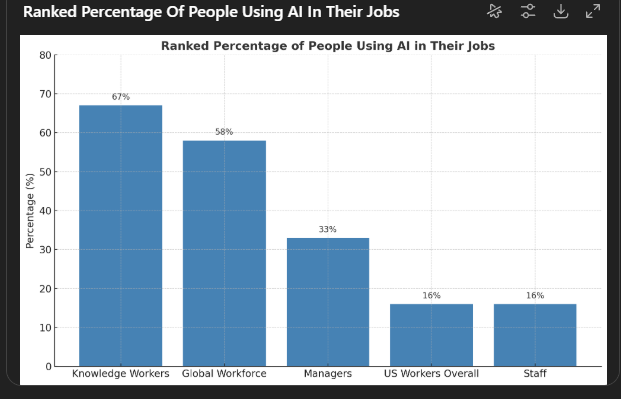
2. Tech boom. We are in a tech boom. This impacts everything. I created the graphic below, for instance, using ChatGPT. When I worked at large financial institutions, there were armies of analysts who did such things.
Source: ChatGPT
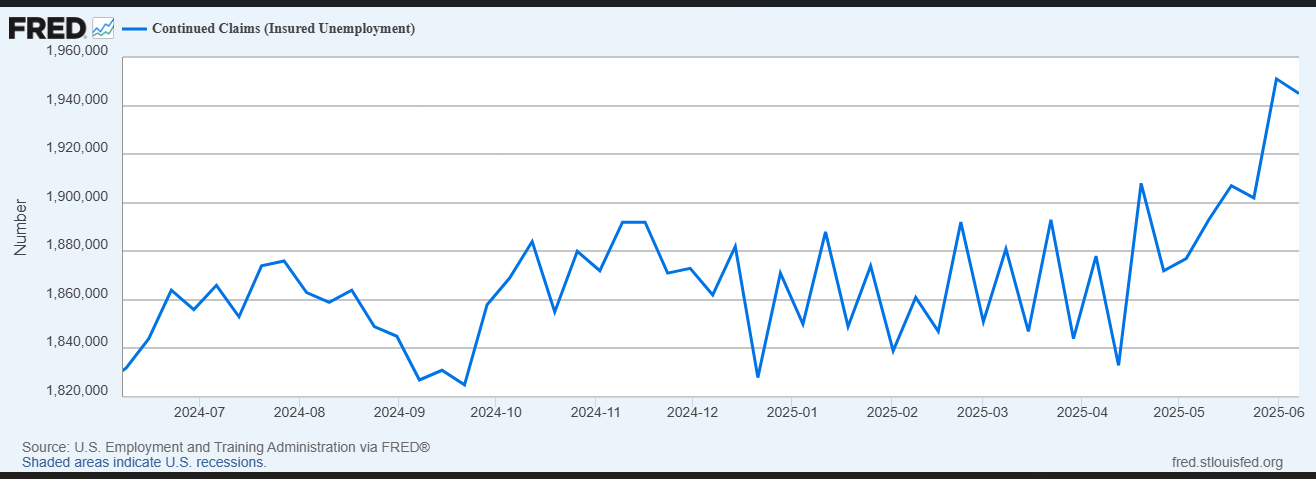
I suspect this is leading to an ebbing in labor market demand. Below are continuing claims for US unemployment benefits. They are clearly rising, though some of this may be seasonal. However, if you look at unemployment in many other countries—Canada, Sweden, Germany, the UK, and China—it is also rising. So, I suspect this is a global trend.
3. Tariffs. I am tired of talking about tariffs, but like a broken air conditioner on a hot day, they are a fact of our lives. As you can see below, we are entering the highest tariff environment in about 100 years. These tariffs weaken growth and boost inflation.
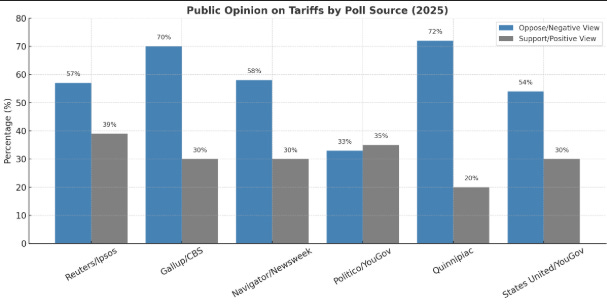
Polling indicates that I am not alone in disliking these tariffs—opposition is widespread. I suspect that the moment these actually show up in higher inflation, the TACO trade will resurface. Everyone on Capitol Hill knows that if inflation returns, the R’s political advantage weakens.
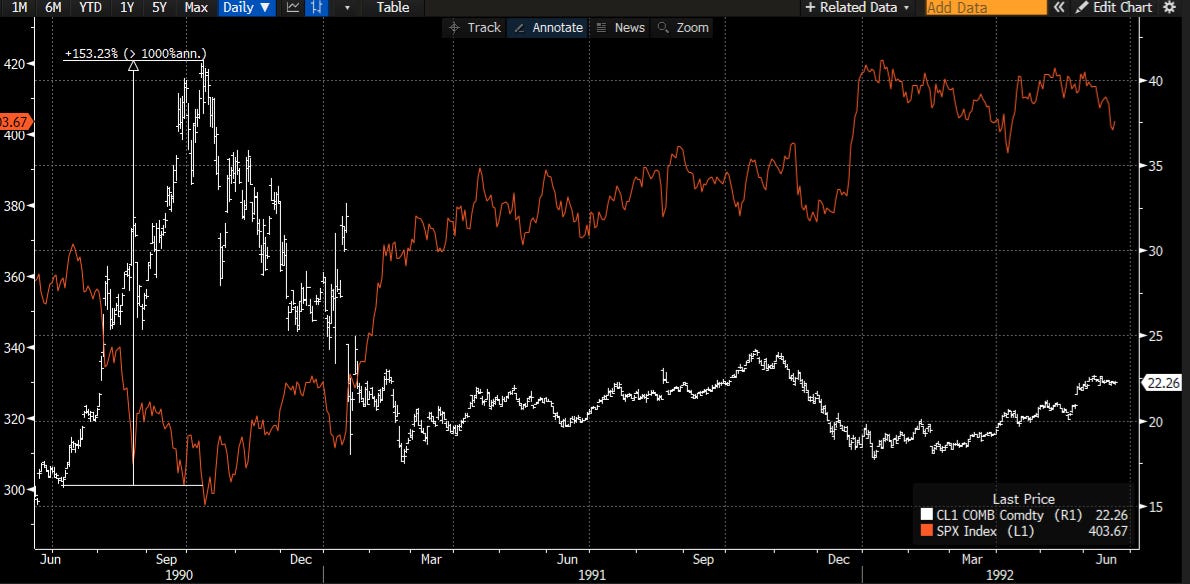
4. War. The previous three forces were already on my radar and have been covered in these posts before. Now we have to overlay the risk of war. We either get TACO (chickens out) or TALO (lashes out). I’m not sure which one. If he drops the bunker buster and Iran retaliates, we’ll see classic war price action—oil and gold up, stocks down. During the first Iraq war, stocks fell about 15% and oil rose 150%. A portfolio needs to be able to endure a war.
What’s Priced In
So far, U.S. stocks are close to flat for the year, and bond yields are little changed. This is because the forces above point in opposite directions: a tech boom and easing inflation pressures are bullish; tariffs and war are bearish. Assets move when the central bank either eases or hikes. And right now, the Fed can do neither.
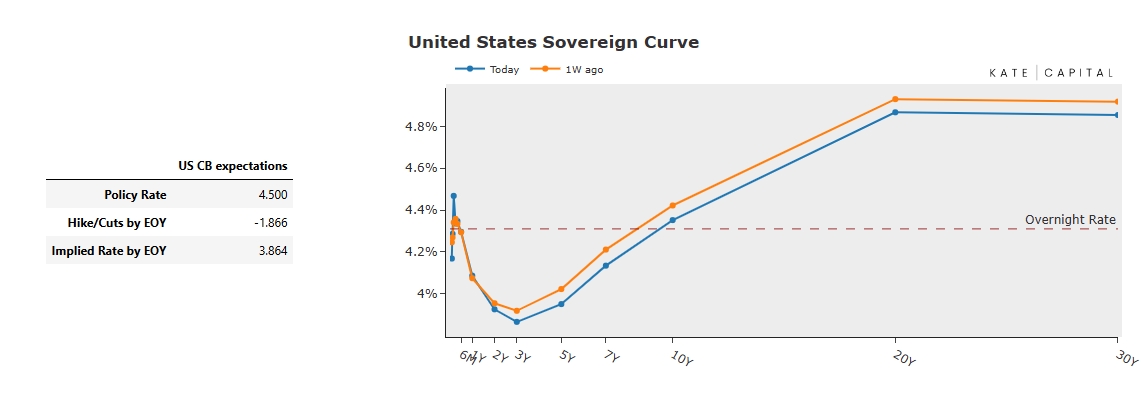
The Fed is both the U.S. central bank and, effectively, the world’s central bank. The problem with going long any asset is that the Fed is already priced in to ease significantly. That means to be bullish on assets, you must believe the Fed will cut more than 100 basis points over the next 12 months. That seems unlikely given the risks from tariffs and potential war.
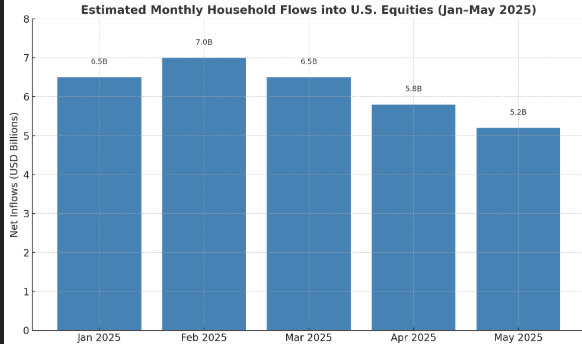
Given the stasis, households are either in cash or dip buying stocks, which they believe will outperform cash.
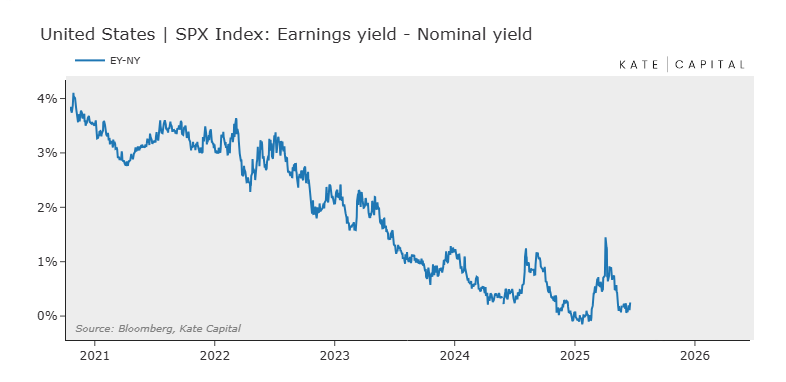
As stock prices have bounced, the risk premium on stocks has shrunk to close to zero, though it is a little higher than it has been. Households don’t seem to care, professional money managers are underweight.
Looking at the four vectors and the discounting, it does not appear to be an attractive time to be long assets. As I said at the outset, relative value bets make more sense, long one asset, short another. If war or tariffs were to go away, that could shift very quickly.

