Substack Library
GlossaryWatching the Bubble Form
July 25, 2025THIS IS NOT INVESTMENT ADVICE. INVESTING IS RISKY AND OFTEN PAINFUL. DO YOUR OWN RESEARCH.
Since the Group of Five meeting, there has been a lot of controversy between the Treasury and the White House, on the one hand, and the Federal Reserve on the other, some of which has seeped into the press.
Soros, The Alchemy of Finance
Typically, there are only two or three adjustments to a portfolio one needs to make each year. There is a flurry of day-to-day noise, but only a few big, correct directional adjustments make the year. We are headed into the last third of the year, and the third phase is likely to be bullish for stocks, bonds, and perhaps even the dollar.
Phase 1 this year was stocks down. That lasted until late April when the White House reversed course on tariffs.
Phase 2 was stocks up, both due to the reversal and strong earnings alongside moderate inflation. If you timed that down-and-up perfectly (no one did), you could hang up your cleats and go home.
Phase 3 is likely to be an acute slowing of growth as U.S. tax hikes take hold, which triggers easier Fed policy, a stock market bubble, and a bond rally. It’s possible the stock market bubble sucks in capital from abroad, driving the dollar up.
At present, there are limited signs of this growth air pocket. The smoking gun would be weak employment, but at present U.S. unemployment is stable, as is unemployment in Europe and Japan. Logic argues that this will shift—perhaps abruptly—lower. But if you’re running a central bank, the evidence is not yet at hand. One month, employment is unexpectedly strong because of a pop in government jobs; another, because of a surge in restaurant hiring. Whatever the cause, the data looks fine.
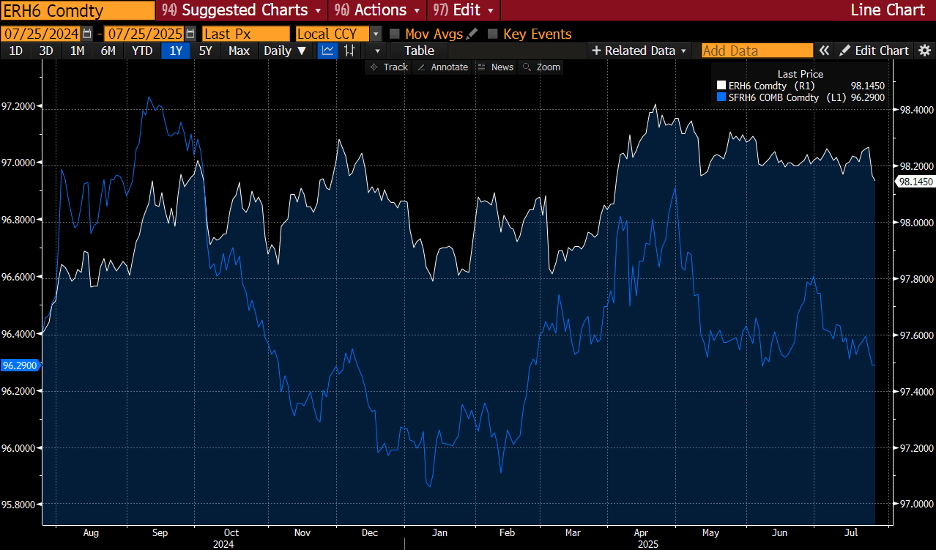
Because evidence of meaningful slowing is so far sparse, expectations of policy action have gradually shifted to less easing and, in Europe’s case, tightening in the out years—which seems odd. The chart below shows expectations of easing in the U.S. and Europe. The white line is Europe, the blue line is the US. From the peak in April, expectations that the trade war will be bad and require easing have gradually dissipated. Said differently: bond traders do not believe that growth will weaken.
Mechanically, spending is income plus borrowing. In the U.S., borrowing is weak because interest rates are high. Only the government is borrowing at these interest rates—and they will probably borrow less in the short term because tariff revenue is pouring in. That means spending should gradually weaken, and with it, employment. As the U.S. ebbs, so too will the world.
There are signs of this in the earnings calls from companies. For instance, Chipotle described consumer spending as soft. “July has been a bit choppy over the last couple of weeks. I think it’s due to kind of some post-holiday [effects] as well as some weather that we’ve seen,” they said on their recent call.
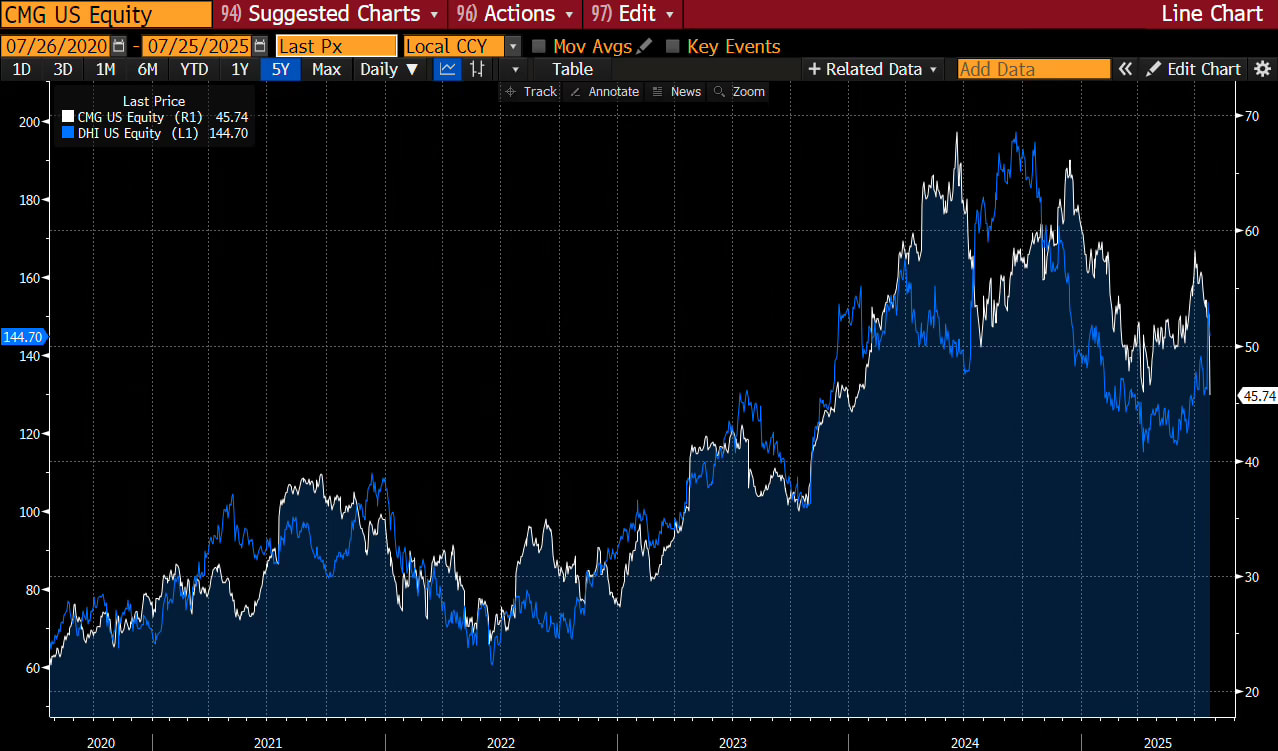
Separately, the homebuilder stocks are shooting higher, as you can see by comparing Chipotle’s stock against D.R. Horton. Homebuilders are sensitive to interest rates, so part of this rally reflects the market’s guess at what comes next—namely, weaker consumer spending, an easier Fed, lower interest rates, and a housing revival. The white line is Chipotle; the blue is D.R. Horton. They are now diverging, though they usually move together.
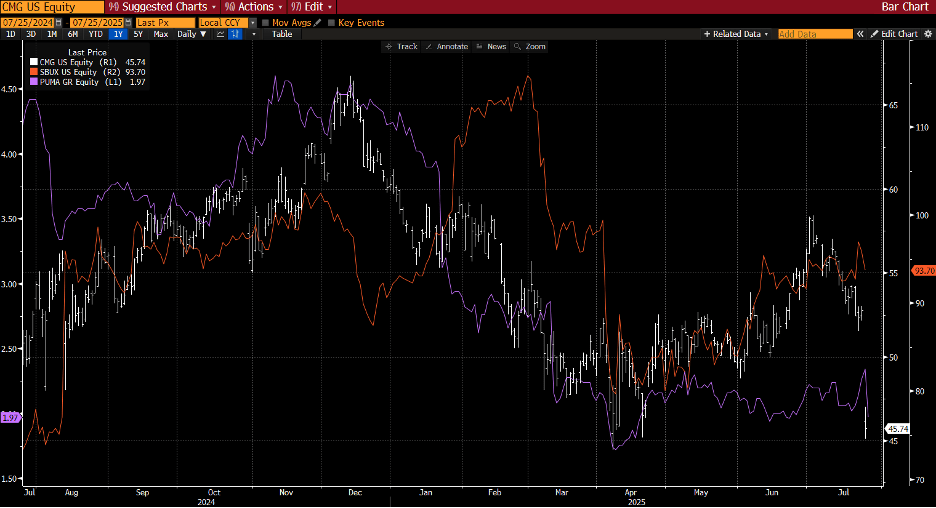
It isn’t just Chipotle—lots of consumer stocks are wobbly. Below I show Chipotle, Puma, and Nike. They are all struggling and say that the combination of tariffs disrupting their supply chains and cautious consumers is causing some pain.
A week from today, we get the latest U.S. data, and most forecasters think it will be fine, though a few outliers are predicting a grim number. There is so much statistical noise in each report that we should not pay attention—but the market does.
The Phase 2 trades—beyond being long stocks—included shorting the dollar and putting on curve steepeners. A curve steepener is buying a short-term bond while selling a long-term bond against it. What is the narrative that would disrupt this?
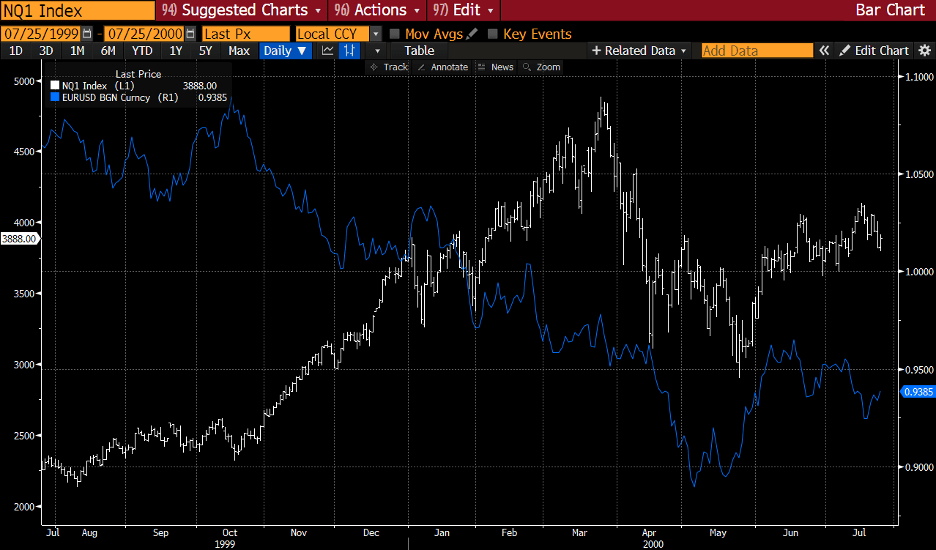
One is that U.S. employment data does weaken, but the Fed is reluctant to cut because tariffs are boosting inflation. Yield curves could flatten because bond traders may focus less on inflation and more on weak growth. The other scenario is that the Fed does ease, and U.S. stocks enter a full-fledged bubble, like in 1999–2000. That bubble pulled capital into the U.S. and drove the euro below parity. If this boom is seen as deflationary, bonds may actually rally. Below I show the euro versus the NASDAQ in 1999. The euro fell for many reasons, but one of them was the draw of U.S. capital markets. Yield curves flattened as well.
Can U.S. assets rally even as U.S. institutional integrity is being eroded? Yes. We need to distinguish between show and content. Yes, attacks on Fed independence are unnerving—but a lot of it seems to be performative, as are parts of the tariff deals. Beyond the show, it looks like slower growth, an easier Fed, and higher asset prices. At some point an asset bubble pops, but typically that requires a central bank to tighten.
Now out in Korean, Italian, Estonian, Chinese and many other languages:
The Uncomfortable Truth About Money