Substack Library
GlossaryWhen Cash Outperforms
November 21, 2025NOT INVESTMENT ADVICE.
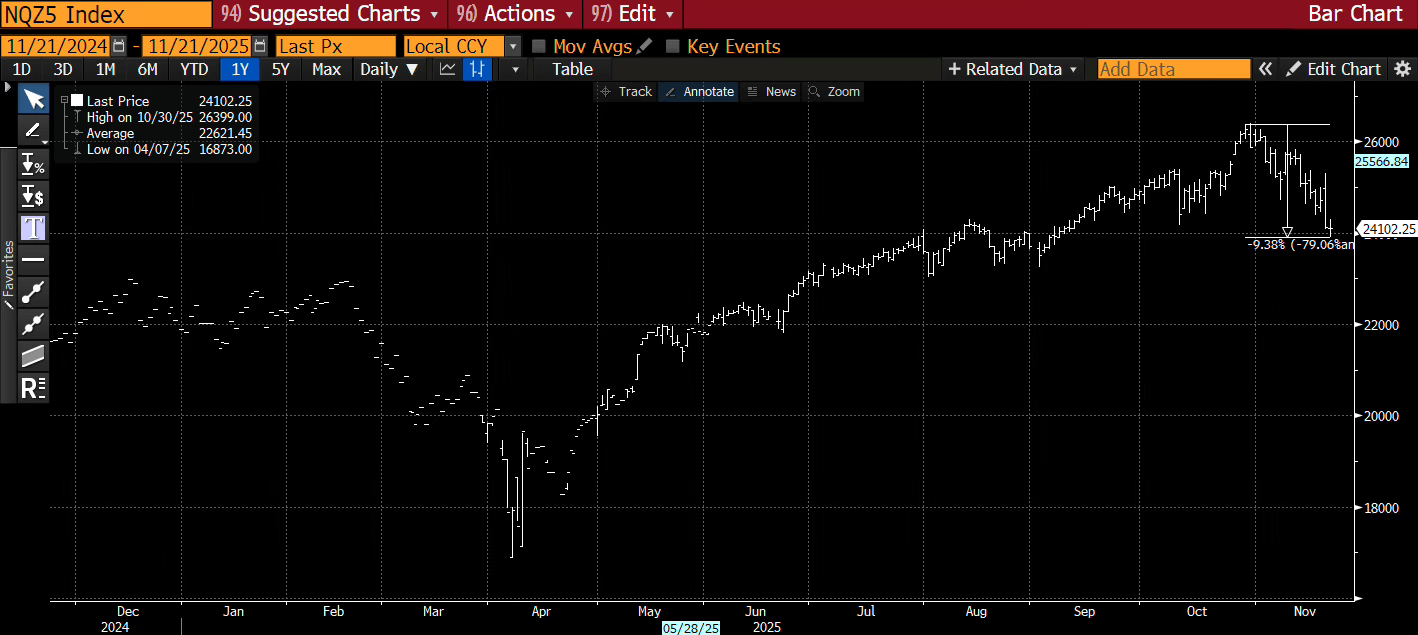
Cash is outperforming assets, a sign central bank policy is tight. In normal times, assets (stocks and bonds) outperform cash. In the last month or so, risk-balanced portfolios, which have roughly equal risk weights to stocks and bonds, have lost over 3%,meaning risk premiums are rising. Bond yields are up anywhere from 10 basis points in the US to 35 in Australia from their October lows. Tech stocks are down 9% from their October highs (image below).
A few observations.
-
The ideal environment for asset prices is a) positive growth, fueled by new whiz-bang technology (be it railroads or AI), b) falling inflation driven by this same technology, and c) central banks that, in response, are boosting liquidity. The opposite is also true. It’s a bad time to own assets when the new tech is deemed to be more fizzle than substance and expected inflation is rising rather than falling.
-
The April to October period was the ideal environment, which is why risk-balanced portfolios are up so much, like 15% to 20%. You could make more money on the AI train, but you needed to know precisely when to get on (late April) and get off (late October).
-
Foreign central banks—Canada, Europe, Australia—have said they don’t need to ease further. The Bank of Japan talks vaguely about raising rates. Canada and Europe in particular cut more than the Fed and there are some signs the stimulation is working.
-
The Fed, on the other hand, doesn’t have a coherent message. Some members believe the Fed should cut, others that it should do nothing or maybe even tighten down the road. What they were waiting for, the members have said, is data to decide the debate but given the nature of the debate, they need something obvious. Subtle won’t shift the balance. It’s plausible that them being undecided triggers enough of a momentum unwind that stocks get whacked, in which case the Fed shifts policy. It’s reflexive.
-
Thursday, the government shared the one employment report before the Fed meets next month. While there are several elements to the report, what is unarguably true is that the unemployment rate rose. The futures contract I noted in last week’s post, SFRZ5, jumped on the news, suggesting increased odds of a rate cut. But this shift in pricing was immediately followed by several members of the Fed speaking, saying that, no, rising unemployment is not the smoking gun because of …. blah, blah, blah. Following the remarks, stocks broke sharply lower.
-
The data suggests that, yes, an AI boom is underway, but the labor market is slowly but steadily weakening. Some of the labor market weakening is probably tied to the very same AI. Many people at the Fed don’t think labor markets are weakening, so markets are beginning to make that clearer to them. That’s why the outperformance of cash is significant. Beyond the stock market and bitcoin, I also track the performance of assets like the Japanese yen, which tends to appreciate when risk appetite unwinds (though to be sure there are a lot of other forces that drive the yen like supply/demand for capital, trade, remittances, valuation, and other variables).
-
Regarding the stock market, valuations are high, but so too have been earnings. The PE on the S&P 500 is unchanged on the year, meaning the year-to-date 11% return was driven by realized and expected earnings, and the forward-looking picture for earnings looks OK. So we are down to a debate about what price investors are willing to pay for those earnings. While valuations are “cheaper” abroad relative to the US, these valuations are just as elevated as the US relative to their own history (meaning Germany is cheaper than the US but expensive relative to Germany’s own history).
-
Beyond valuation, a flows-based perspective on stocks is helpful. Retail is buying as are the corporations themselves (buybacks), but institutional investors are not at these prices. Once stocks turn lower, trend-following investors follow the trend, meaning for each tick lower in stocks they sell more, like billions more. This then influences the positions of options dealers who need to sell more futures to keep their books in balance and smaller moves exaggerate into bigger moves. A divided Fed kicks these forces into motion, which now need to run their course. It will feed on itself, like an illness, until it burns through the host. If Powell, the Fed chief, were to come out and say flatly that he sees more risk to the labor market than inflation, the tone may change. I put about 30% odds that the stock market needs to fall a chunk further before he is rousted from his silence. The markets trade as if a policy error is underway.