Substack Library
GlossaryChickens and the Roost
February 28, 2025No Louvre, no castles on the Loire, can offer so many pleasant and unforgettable sensations as the gloomy and humble interior of the Hotel Vorkuta.
Imperium, Ryszard Kapuscinski, 1994
THIS IS NOT INVESTMENT ADVICE. INVESTING IS RISKY AND OFTEN PAINFUL. DO YOUR OWN RESEARCH.
The US stock market is falling due to a combination of over-valuation, slowing growth, tariffs, and a flows profile that was, up until a few days ago, max long. A stock price, like any other price, is formed by supply and demand. Most of the buying in recent weeks has come from US retail, and now those buyers are getting crushed on their favorite stocks, like Nvidia. If US households lose confidence in the stock market, other buyers may be few and far between until prices gap low enough to attract meaningful institutional and foreign interest.
The Sequence
While it is difficult to pinpoint a specific catalyst for the decline, I believe it was the White House labeling Zelenskyy a dictator last week. The kindling for the selling fire was everything I noted above (valuation, tariffs and flows). But the match was the Administration siding with the Kremlin. Americans don’t agree on much, but they do know Ronald Reagan, Tom Clancy, and Rocky thought the Kremlin was the bad guy. Add to that Putin’s slaughter of Ukrainian women and children, and even those who can’t find Ukraine on a map have a basic sense of who started the war. In the debate of whether the current Administration is iconoclastic genius or unhinged, the Zelenskyy comment might have tilted perception.
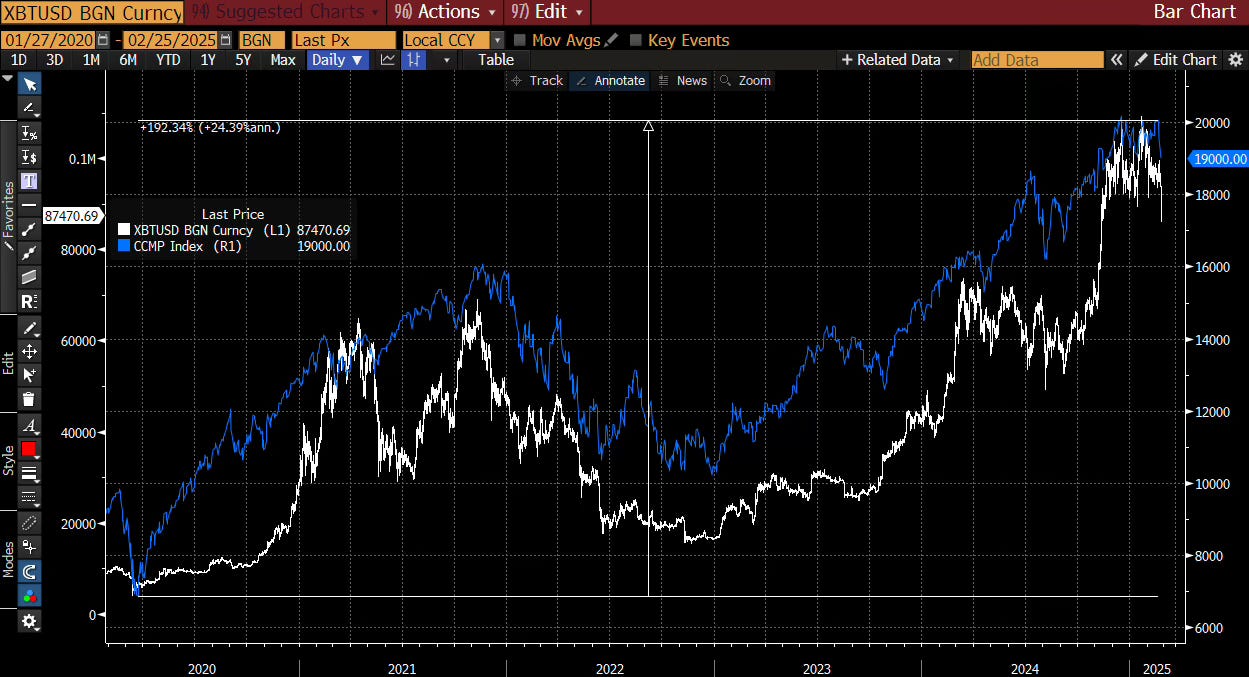
Once stocks start to slide, it kicks off a chain reaction. The vast majority of discretionary spending in the US comes from a small slice of the population, the wealthy. These people mostly live between DC and Boston and LA and San Francisco and are mostly in tech or finance or supporting people like tech and finance, like doctors and lawyers. They own a lot of stocks. These people experienced a huge increase in wealth post-COVID because a) their real estate increased in value, and b) their stocks increased in value. Those who own crypto got an additional kick. As you can see from the chart below, their wealth rose about 200%. The blue line is the NASDAQ and the white is crypto. That now goes into reverse, meaning a wealth effect becomes a wealth hit. Most people experience the loss of wealth (2008) far more acutely than the increase in wealth (the last five years).
Moreover, falling stocks directly feed into falling prices because brokerage fees dry up, which lowers CPI. So a fall in the stock market reverberates through spending and inflation. The Administration wanted to get bond yields lower; a steep stock market decline is one way to do that.
Fiscal Tightening
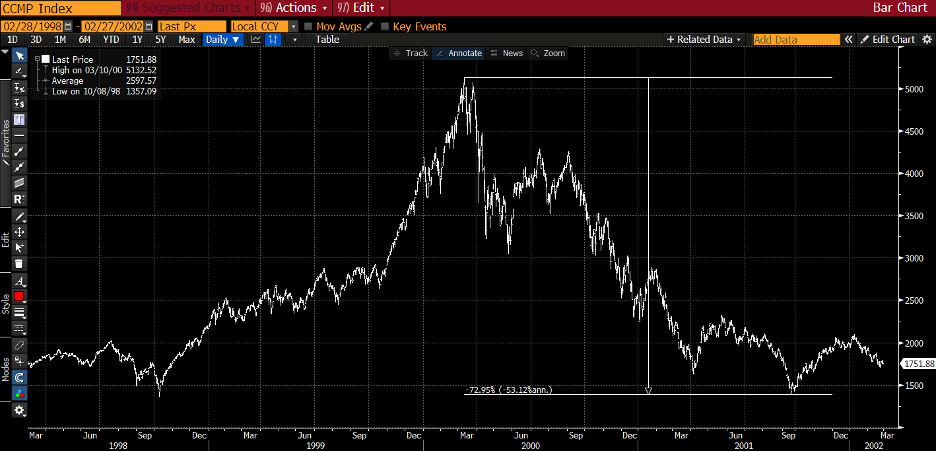
Each financial bust is a little different than previous ones. This one is sort of like what happened in the 2000 tech wreck. In 1998, in the midst of a tech boom, we had an economic crisis (the Asian financial crisis), the Fed cut rates in response, and the combo of the tech boom and the cuts drove stocks to high valuations. When the Fed reversed those cuts in 1999 and 2000, it led to a stock market decline, in percentage terms a cool 70%.
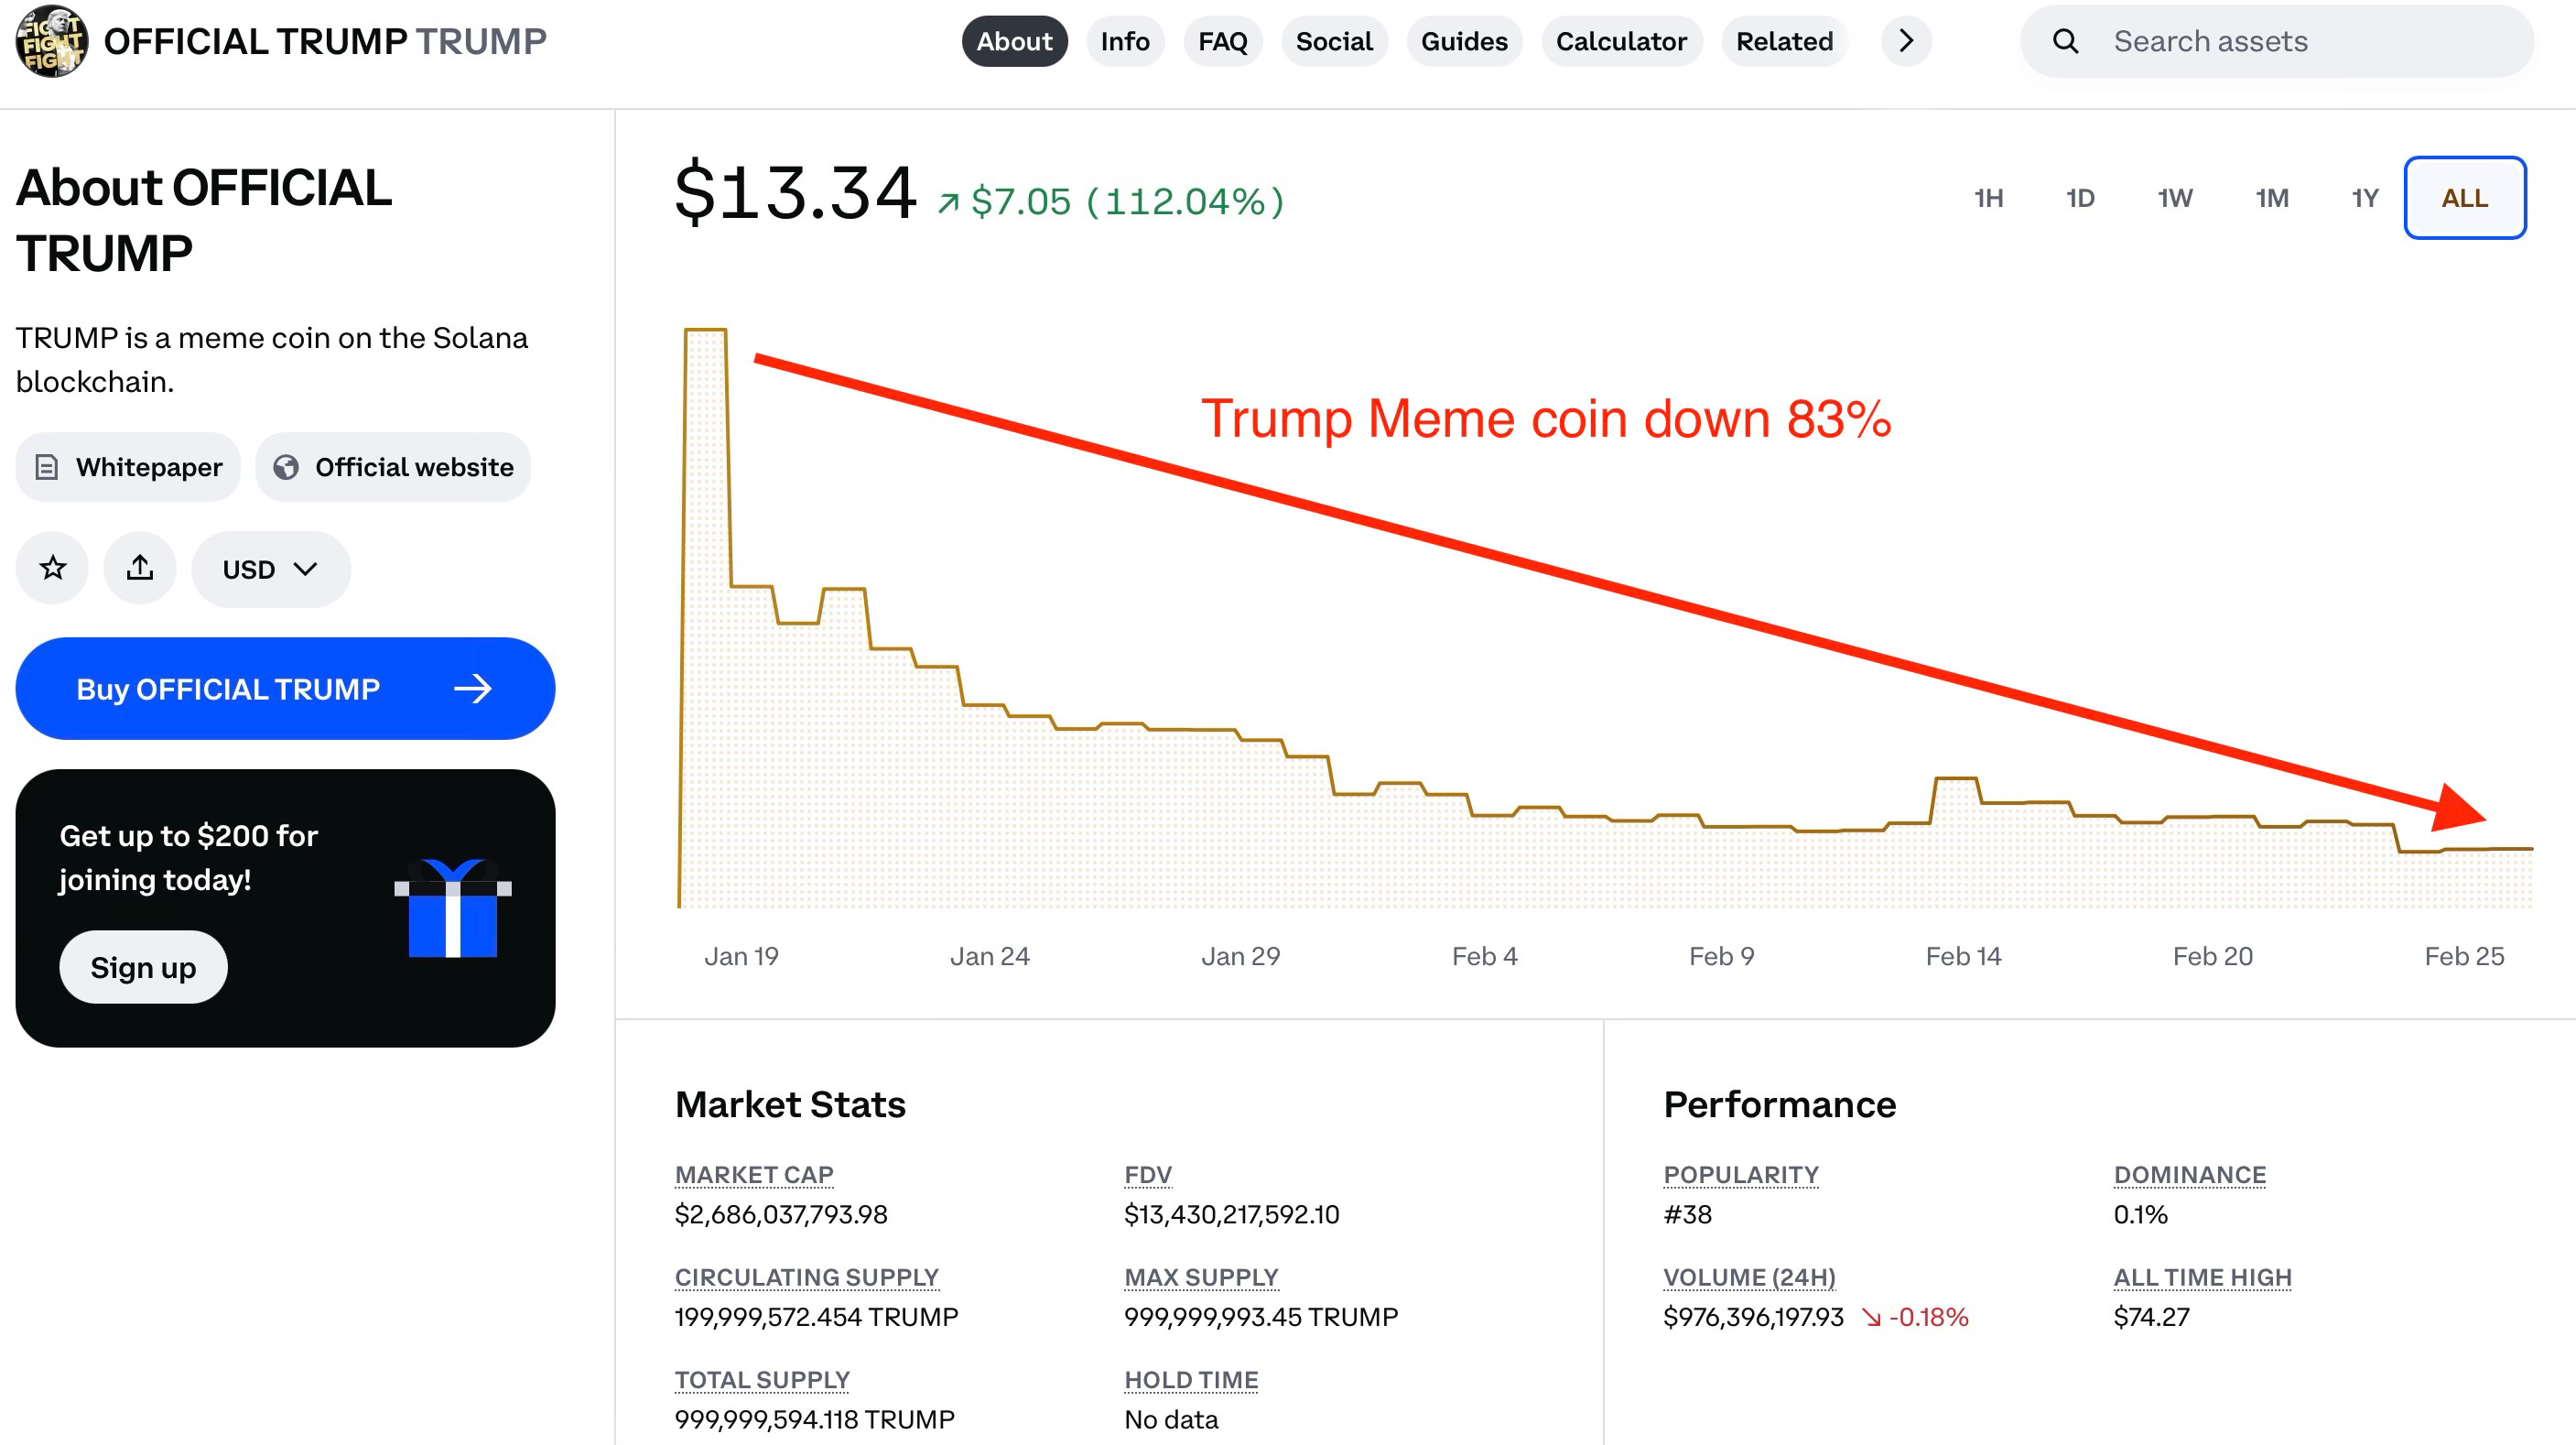
This time we also had a tech boom (AI) but we had COVID instead of a financial crisis, and got both monetary and fiscal easing (infrastructure spending), which is what led to the huge run-up in asset prices I showed earlier. In 2022, the Fed began to unwind this stimulus and stocks got smushed. But as valuations declined, AI buzz continued and fiscal remained extremely easy, stocks vaulted higher. What is happening now is that we are getting a fiscal tightening. What? Aren’t they about to cut taxes? Yes, but tariffs are a tax hike. Moreover, they are a tax hike that weakens rule of law because the US has trade treaties with Mexico and Canada. Crypto may be leading stocks. Crypto has fallen sharply in recent months. The most egregious example is the Trump coin, which is off about 80% from its post-launch levels.
What’s Next?
From here, I suspect these moves accelerate up to the point that the Administration shifts course. If, for instance, the White House backs away from tariffs that are now expected to kick next week, we will get a rally.
Over time, stocks go up. But at points in time, they go down a lot. There are many wonderful companies available for sale each day. It just might be that the right price is a lot lower. Stocks fell 90% in the Great Depression, 70% as I noted in the tech bust, and over 20% as recently as 2022. Stocks fell about 20% during the last round of tariffs, though pricing was far less extreme than now, meaning investors were paying about 20% less for a share of earnings than they are today. By the way, if you ever wonder about the origin of the word “hedge fund” it is an investment vehicle that can be hedged (protected) from falls in the stock market.
Navigating bear markets is different than up markets. Typically, big down moves are interrupted by violent counter-trend upswings, what’s known as a short squeeze. Given that stocks rise over time, losses from shorting are theoretically infinite. Generally, the more stocks fall, the further authorities swing into action via monetary policy or moderating policies (like tariffs) that are causing the downswing, but often these interventions don’t initially work and are slow to come about. Meanwhile, the stock down move triggers weaker growth, which then feeds further down moves. When I wrote in The Uncomfortable Truth About Money about the instability of money, it was dynamics like this that I had in mind.