August 7, 2026
Not investment advice.
In the next few weeks, it all comes down to inflation.
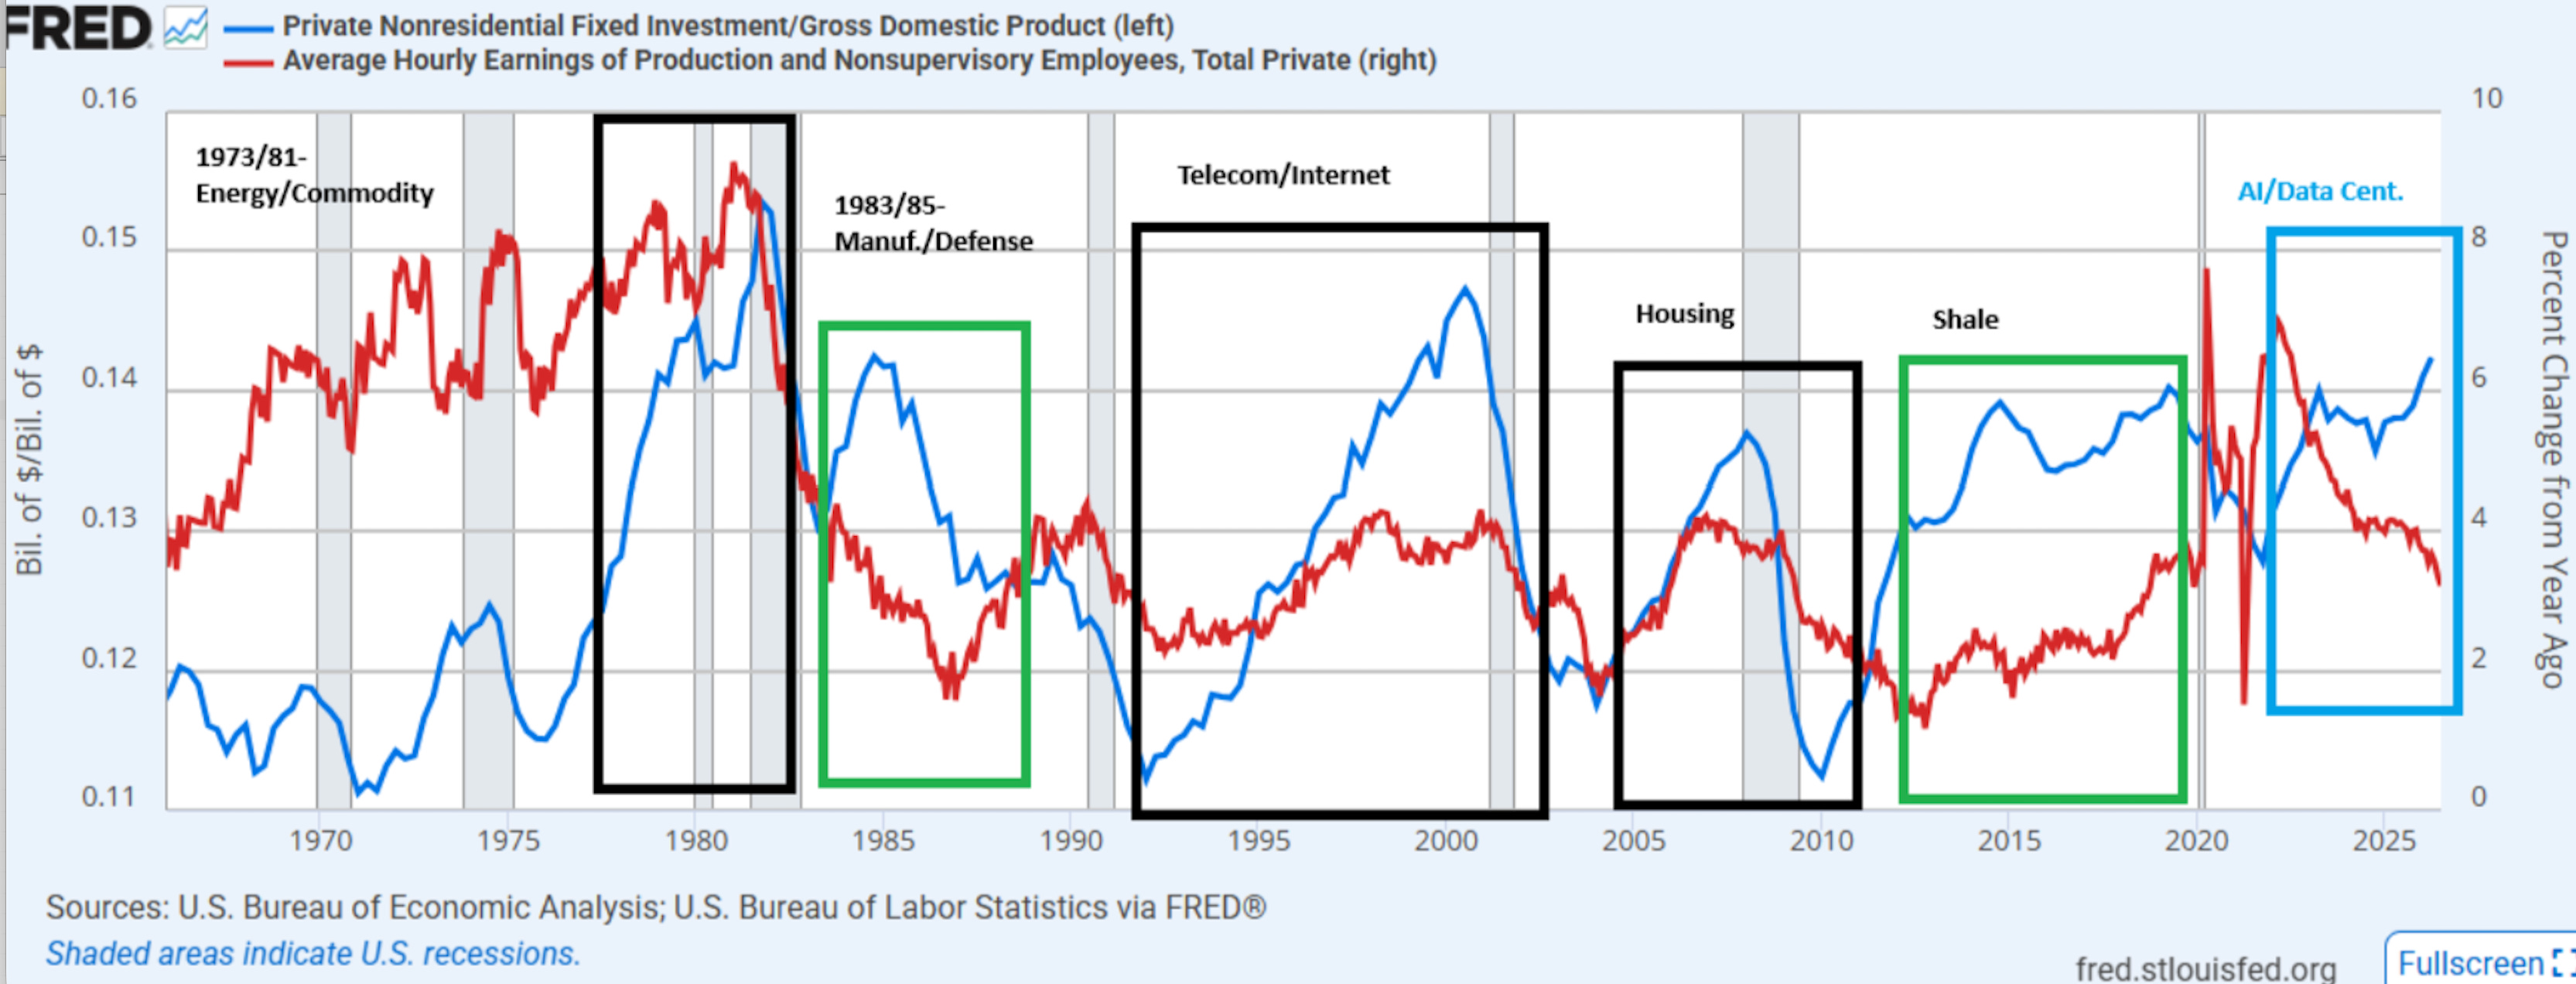
There are two types of productivity booms—inflationary ones and non-inflationary or deflationary ones. The 1996–2001 boom was non-inflationary. The 1970s tech boom (the beginning of more widespread use of computers) was inflationary, as you can see below. Much of it depends on how much money goes to labor, the most significant input into any inflation model. Of course, oil shocks don’t help.
We are in a productivity boom and, when it comes to stocks, a frenzied boom. Kate’s measures of US growth are hot, for the reasons I have said before—big fiscal deficit, significant corporate spending. Equity valuations (in aggregate) are elevated, thus vulnerable to a tightening.
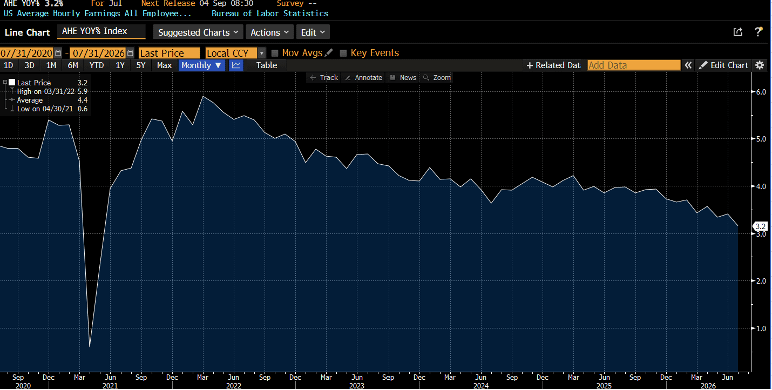
If inflation accelerates, the Fed will have to raise rates multiple times. While it won’t bite the first time, the third or fourth hike will probably end the equity rally, perhaps violently. But inflation measures are not accelerating. At least, not yet, despite fast growth. The prime culprit is average hourly earnings, below. They are clearly decelerating.
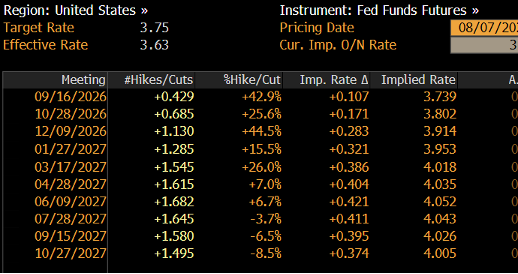
Fed chief Warsh doesn’t want to raise rates and some who get down into the details of CPI, see high odds the next few prints will be benign. The difference between 0.15 versus 0.30 a month matters. The next inflation data comes out next week. If it’s 0.2 or below, poof, there goes the September rate hike, currently at 42% odds.
In the 1970s, bonds got hammered. Stocks had big booms and busts and went nowhere for…14 years (68-82). A rise in inflation may still occur given how strong growth is, but timing matters and for now the inflation pot is off the boil, which is bullish bonds and reduces the risks on stock valuations.
“Letter”) only. It includes personal opinions that are current as of the date of this Letter and does not represent the official positions of Kate Capital LLC (“Kate Capital”). This letter is presented for discussion purposes only and is not intended as investment advice, an offer, or solicitation with respect to the purchase or sale of any security. Any unauthorized copying, disclosure, or distribution of the material in this presentation is strictly forbidden without the express written consent of Paul Podolsky or Kate Capital LLC.
If an investment idea is discussed in the Letter, there is no guarantee that the investment objective will be achieved. Past performance is not indicative of future results, which may vary. Actual results may differ materially from those expressed or implied. Unless otherwise noted, the valuation of the specific investment opportunity contained within this presentation is based upon information and data available as of the date these materials were prepared.
An investment with Kate Capital is speculative and involves significant risks, including the potential loss of all or a substantial portion of invested capital, the potential use of leverage, and the lack of liquidity of an investment. Recipients should not assume that securities or any companies identified in this presentation, or otherwise related to the information in this presentation, are, have been or will be, investments held by accounts managed by Kate Capital or that investments in any such securities have been or will be profitable. Please refer to the Private Placement Memorandum, and Kate Capital’s Form ADV, available at www.advisorinfo.sec.gov, for important information about an investment with Kate Capital.
Any companies identified herein in which Kate Capital is invested do not represent all of the investments made or recommended for any account managed by Kate Capital. Certain information presented herein has been supplied by third parties, including management or agents of the underlying portfolio company. While Kate Capital believes such information to be accurate, it has relied upon such third parties to provide accurate information and has not independently verified such information.
The graphs, charts, and other visual aids are provided for informational purposes only. None of these graphs, charts, or visual aids can of themselves be used to make investment decisions. No representation is made that these will assist any person in making investment decisions and no graph, chart or other visual aid can capture all factors and variables required in making such decisions.xyz