Substack Library
GlossaryEquity Declines In Perspective
March 14, 2025He always had a similar reaction when he knew he would be in combat in a few seconds. It always seemed impossible he would move or fire his gun, expose his life, and yet he always advanced.
The Naked and the Dead, Norman Mailer, 1948
THIS IS NOT INVESTMENT ADVICE. INVESTING IS RISKY AND OFTEN PAINFUL. DO YOUR OWN RESEARCH.
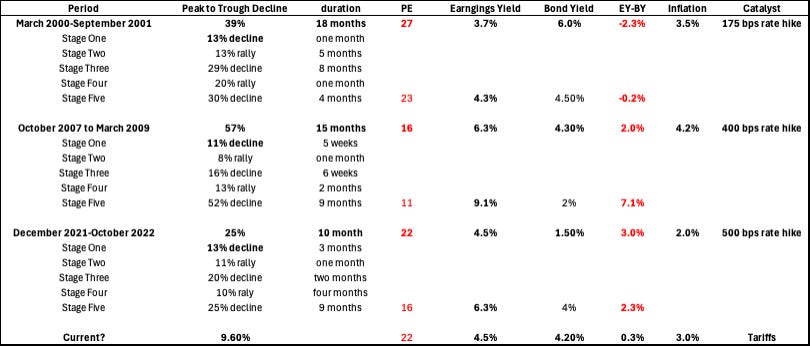
Over time, stocks go up. Painful bear markets, by which I mean declines of more than 20% in a year, are infrequent, occurring less than 10% of the time. I’ve traded through three of them, 2001, 2008 and 2022 and I went back to look at the details of each and see how today’s market action compares. My take-home point—in terms of stocks declines, we have not seen anything significant yet, but the ingredients are in place for something significant. So far the S&P 500 is down 4.5% this year. High valuations are meeting with tighter fiscal policy and, given the inflation dynamic, less flexibility on the part of the Fed. That is a dangerous combination.
Below is a table summarizing how things played out. The equity market falls about 40% on average and, within this decline, there are significant counter-trend rallies of 10% to 20% within that downtrend. For simplicity, the index below is always the S&P 500 even though at times the epicenter of the correction was within a different index, like the NASDAQ in 2000.
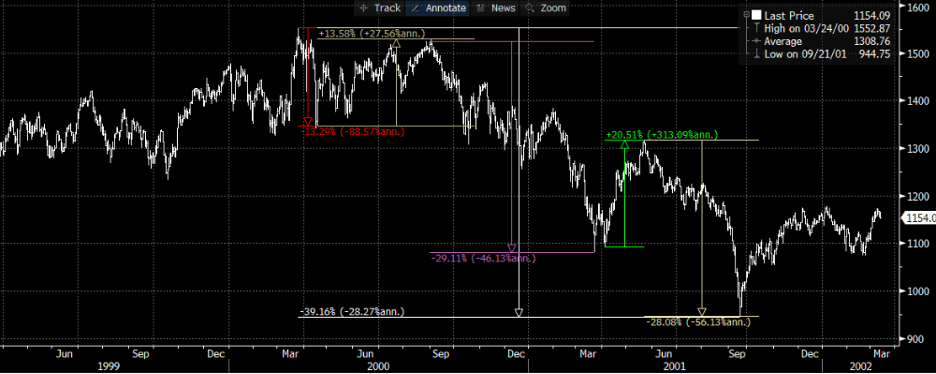
2000
This was the tech wreck. Of all the stock corrections, this had the most egregious pricing. The risk premium of stocks to bonds was solidly negative (the earnings yield minus the bond yield was negative). The catalyst for the correction was Fed tightening, but not a big one, essentially reversing the 1998 rate emergency cuts and adding a little more in. There was a Wile E. Coyote moment when stock markets continued to bang around at the highs for some time after the Fed hikes. I always find the gap between the cause (tight money) and the effect (falling stock prices) odd.
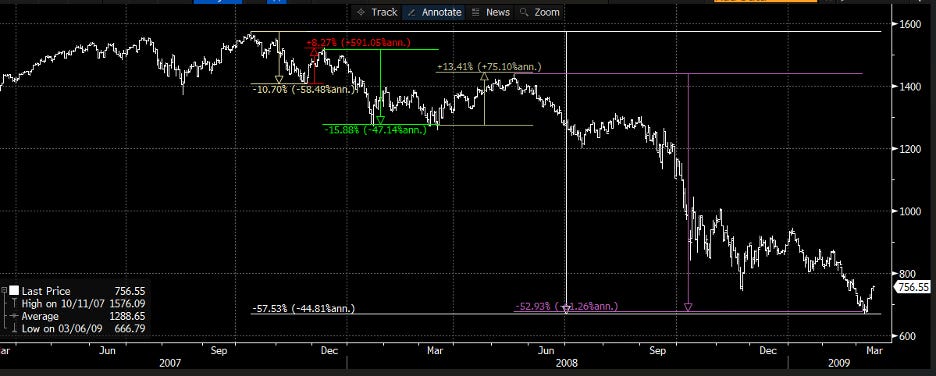
2008
This was the credit bubble. This also took a long time to manifest. Housing prices looked elevated in 2006 and it took time for the bubble to gain momentum, but ultimately stocks fell almost 60%. The key issue was debt obligations. Today, in general, household and corporate balance sheets are much healthier. Still the self-reinforcing nature of the decline was pernicious, the more asset values fell, the more likely they were to fall further, until the Fed stepped in with massive easing.
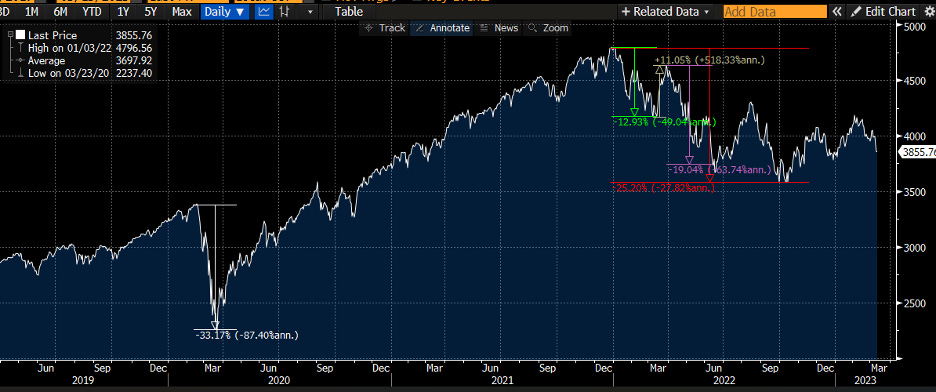
2022
This was the big Fed adjustment (following on the Covid stock correction, which was short and sharp). Rates had been close to zero and post-Covid stimulus led to a large rise in inflation which, as the Fed belatedly responded, caused a dramatic increase in interest rates, leading to a 20% decline in stocks.
2025
Today we have valuations that are not quite as extreme as 2000 but are high. The Fed has been easing, not tightening. But fiscal policy is getting tighter, possibly much tighter depending on how high tariffs go. Reciprocal tariffs arrive in about two and a half weeks. Moreover, inflation is not coming down. It looks like the Fed’s preferred measure of inflation is around 3%, meaning the Fed cannot cut until unemployment goes meaningfully higher. A stuck Fed and fiscal tightening are not a good combo for risky assets, though of course counter-trend rallies are to be expected.