Substack Library
GlossaryReality Gradually Seeps In
March 28, 2025THIS IS NOT INVESTMENT ADVICE. INVESTING IS RISKY AND OFTEN PAINFUL. DO YOUR OWN RESEARCH.
The gap between perception (things seem more or less normal, kinda, right?) and reality (things are not normal) is gradually being closed. The gap is clear in one objective measure: prices. Even with the recent volatility in asset prices, the yields on government debt and the price savers pay to own stocks are both high—while the underlying economic activity that supports these valuations is rapidly deteriorating due to a fundamental, under-appreciated shift in government priorities.
The financial architecture we live within is largely invisible—because it works. It’s like vaccines: you don’t notice them until people stop taking them, and the diseases they prevent reappear. Only then do the benefits become obvious again. The current Administration is fundamentally altering that financial architecture. Their belief is that by changing the location where cars, medicine, or AI are produced and sold, life will improve.
The previous system that existed as recently as November was built around a different goal: employment. If unemployment was low, that was good. If it was high, that was bad. Below, I show unemployment back to the 1950s
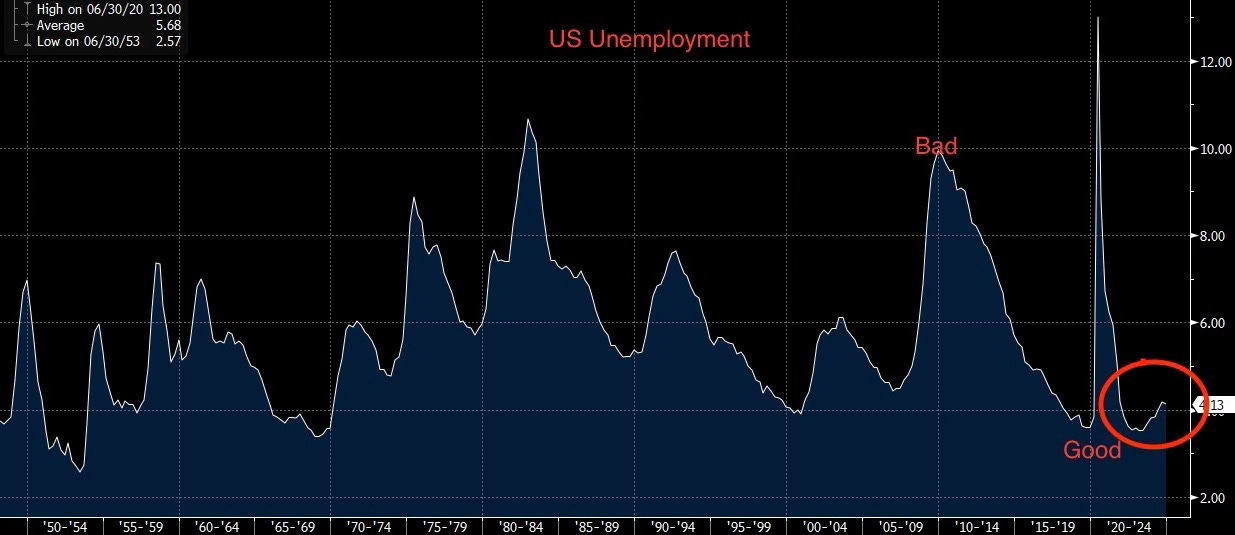
It didn’t matter whether someone was producing goods for domestic or foreign consumption—what mattered was whether they had a job. By that measure, things were good when this Administration took office. Unemployment was around 4%. But employment is no longer the primary goal, which is why unemployment is likely to rise.
We began measuring unemployment closely during the Great Depression (1929–1933). Back then, the U.S. central bank (and others in Europe) believed they could only print as much money as they had in gold reserves. This “hard money” mindset, based on the gold standard, was a terrible idea. It tied the money supply to the randomness of gold discoveries, making monetary conditions unresponsive to economic conditions.
During the Depression, U.S. unemployment rose to 25% due precisely to this policy. My father and grandfather lived through that period—I remember their harrowing stories vividly. All of it happened because policymakers clung to bad ideas. (Ditto other egregious policy errors, like the Vietnam War.) It took years of suffering before the 1930s leaders abandoned the gold standard—and the economy rebounded almost immediately once they did.
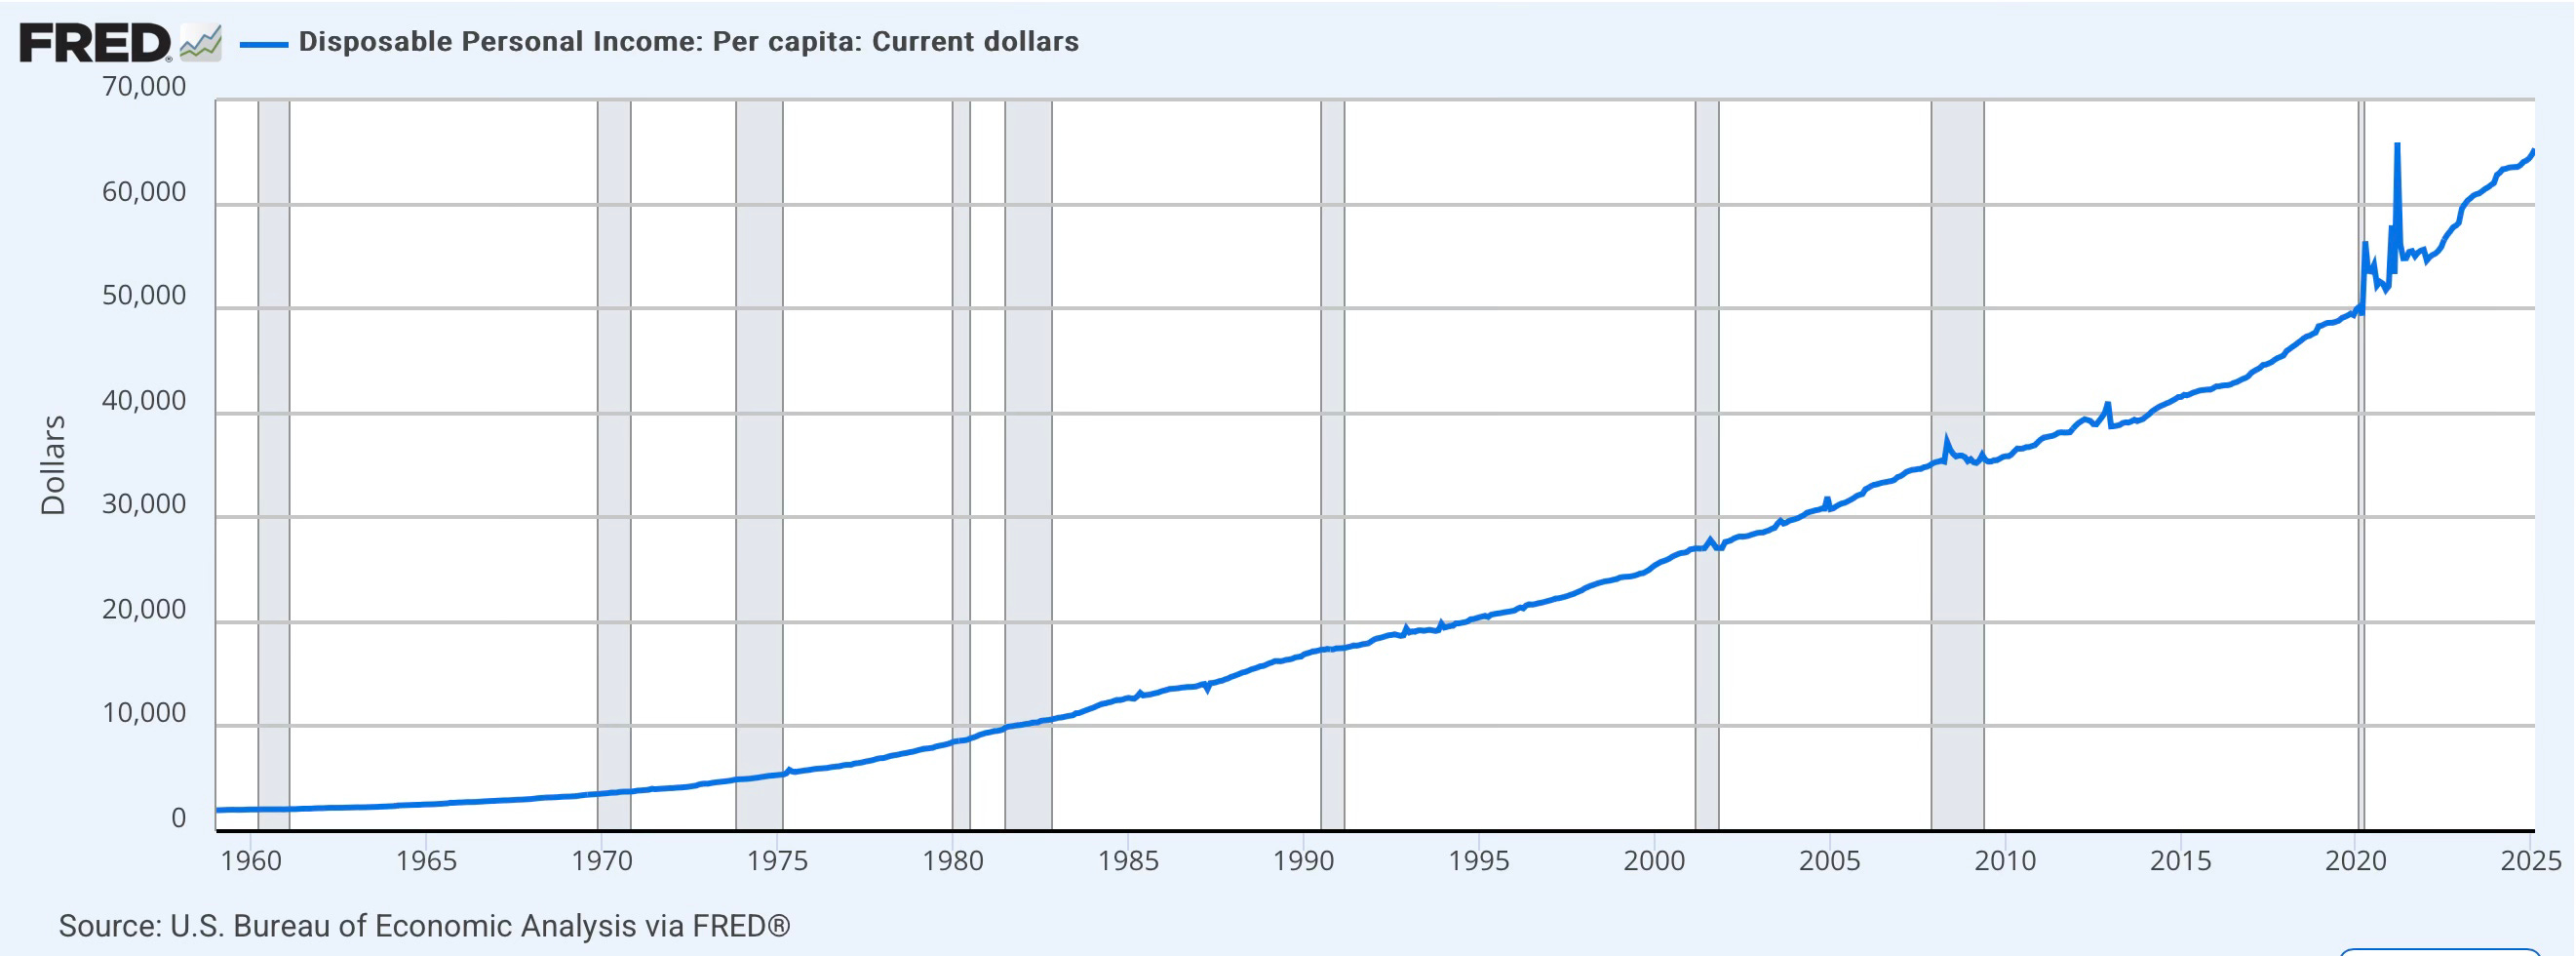
From the current Administration’s point of view, the world may look like this: lower income Americans have been hurt by free trade. In reality, free trade has created unprecedented wealth and significant income inequality. Below I show disposable income in constant (inflation adjusted) dollars. This is a result of focussing on the goal—low unemployment.
The Administration’s thinking goes: bring factories back to the U.S., raise revenue via tariffs, and use that money to cut taxes. This may hurt the stock market, they might reason, but it could also lower interest rates. Voilà: the lower-income family now has a factory job and cheaper borrowing costs thanks to falling bond yields.
The problem is that, like the gold standard or anti-vax, tariffs are a terrible idea. We live in a deeply interconnected global trade system, developed over the last 100 years. Disrupting it with radical shifts—like widespread tariffs—will bring the very problems economists warn about: weak growth, high inflation, and rising uncertainty. That uncertainty, in turn, leads to businesses pulling back—and unemployment to rise. Put yourself in Tim Cook’s shoes, the CEO of Apple. You sell globally and produce globally and now, with just a few weeks notice, you are supposed to shut all that down?
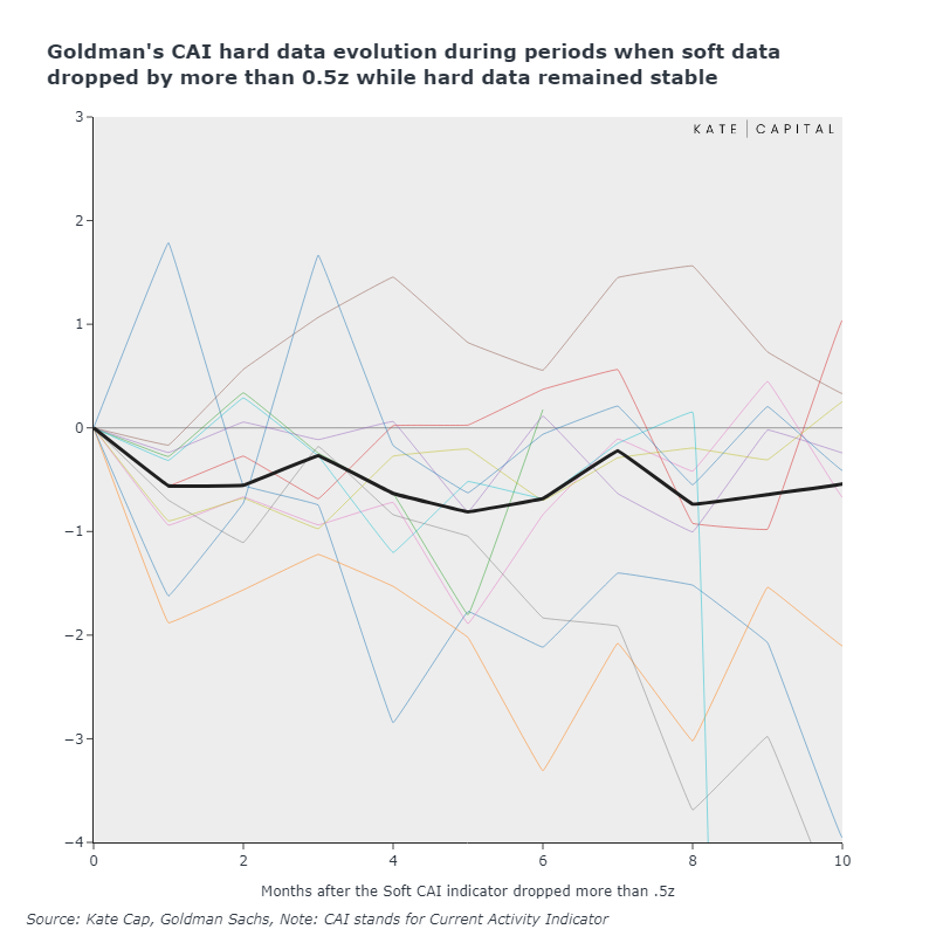
The soft data—surveys—have already turned sharply negative. Consumer confidence is sinking. The stock market has stalled and is down a few percent. Unemployment, so far, remains stable. But historically, when soft data dives, hard data like job growth tends to follow. In fact, about 80% of the time, soft data leads. We anticipate that monthly U.S. job growth will slow meaningfully in the coming months. Below is a chart we created showing all cases over the last 50 years where soft data fell sharply. In most, hard data (employment) follows.
We also dug into the WARN notices—mandatory filings that companies with more than 100 employees must submit when laying off more than 50 workers. I focused on the border states—Texas, Michigan, and Wisconsin—to get a clearer view, but so far, no strong pattern has emerged. That’s despite anecdotal evidence that things are rapidly deteriorating. One auto dealer quoted in the paper described business as the worst it had been since 2008!
Next week, the full tariffs are expected to be announced. Many still believe the Administration will be “reasonable.” During Trump’s first term, there was plenty of talk about higher tariffs, but what was actually implemented was fairly modest. This time, though, it’s shaping up to be a very different scale. Going from the shock of work to no work to actually filing for unemployment can take a while, so nothing might show up in the data for months. But if the Administration comes out with high tariffs, unemployment will start to rise.
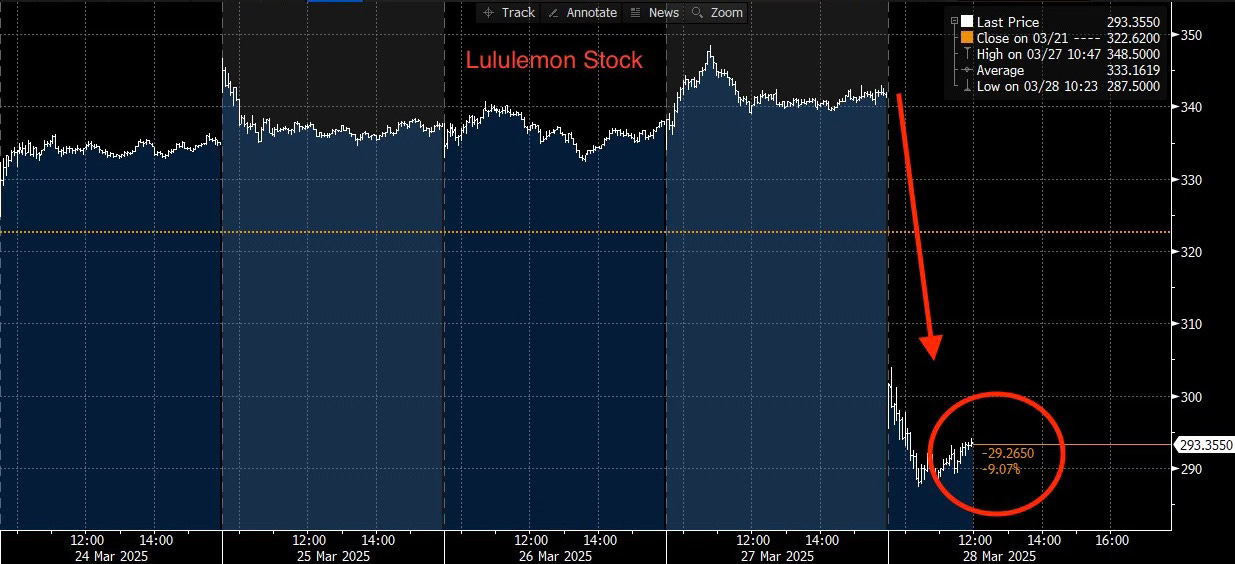
Perhaps a taste of what is to come with assets was evident today in the earnings of Lululemon. They announced weaker-than-expected earnings and the stock fell sharply. Interestingly, the stock is already trading at a price to earnings ratio below its long-term average. Said differently, long-only “value” investors aren’t touching the stock even if it’s “cheap.” Given that the market overall is too expensive for value investors, this one data point suggests that stocks could fall below their long-term average price before buyers emerge. I also don’t hold out much hope on the Administration rapidly reversing direction, no matter what the consequences. The fact pattern from both Trump’s first term and the leadership of similarly inclined leaders does not suggest a readiness to quickly recognize policy error.